
Introduction
64QAM or 64 Level Quadrature Amplitude Modulation is a digital modulation technique used as a basic building block within the OFDM Orthogonal Frequency Division Multiplexing waveform used in Cellular Telephony LTE & 5G networks (Ref.1). QAM modulation encodes information into the different amplitude and phase levels of a carrier wave.
Construction
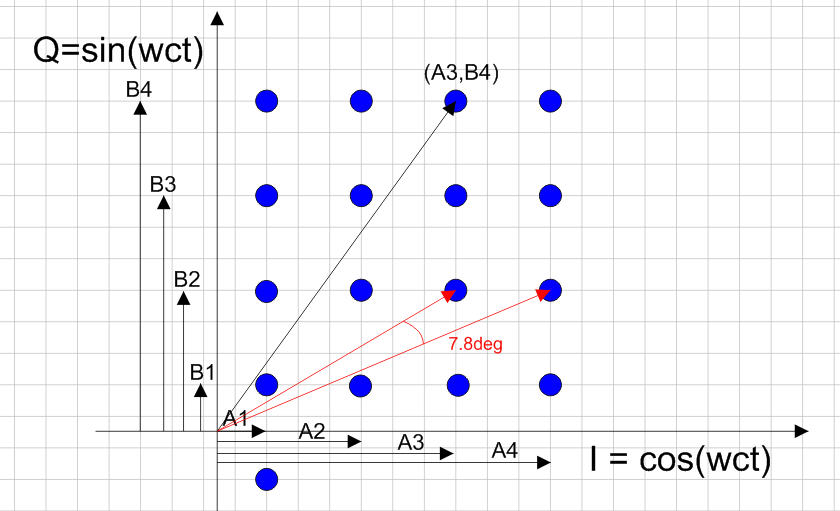
One way to construct a QAM signal is to combine various amplitudes of two vectors I & Q formed by I = Acos(wct) and Q = Bsin(wct). This construction method is shown in Figure 1. Point (A3,B4) is formed by adding Amplitude A3 of cos(wct) to Amplitude B4 of sin(wct). QAM = A3*cos(wct) + B4*sin(wct). For a 64QAM signal, there are 16 points in the 1st quadrant and 16 points in each of the other 3 quadrants totaling 4 x 16 = 64 points. The 64 points can be generated by 8 different amplitudes of A (+/A1, +/-A2, +/-A3, +/- A4) and 8 of B. Each point represents one unique combination of 6bits (2^6=64).
Simulation
Figure 2 shows the Scicos Model used to construct a 64QAM modulator. Random data is generated by the Random Integer Generator which outputs an integer from 0 – (M-1) where M = 2^N. For 64QAM, M = 2^6, N = 6, (M-1) = 63.
The 64QAM modem simulation parameters are:
-Fc = 1000Hz, M = 2^6 = 6bits/baud
-R = 800bits/sec, B = Baud Rate = 800/6 = 133.3baud/sec
-Tbaud = 1000msec/B = 7.5msec
-First Null = Fc +/- Baud Rate = 1000Hz +/- 133.3Hz
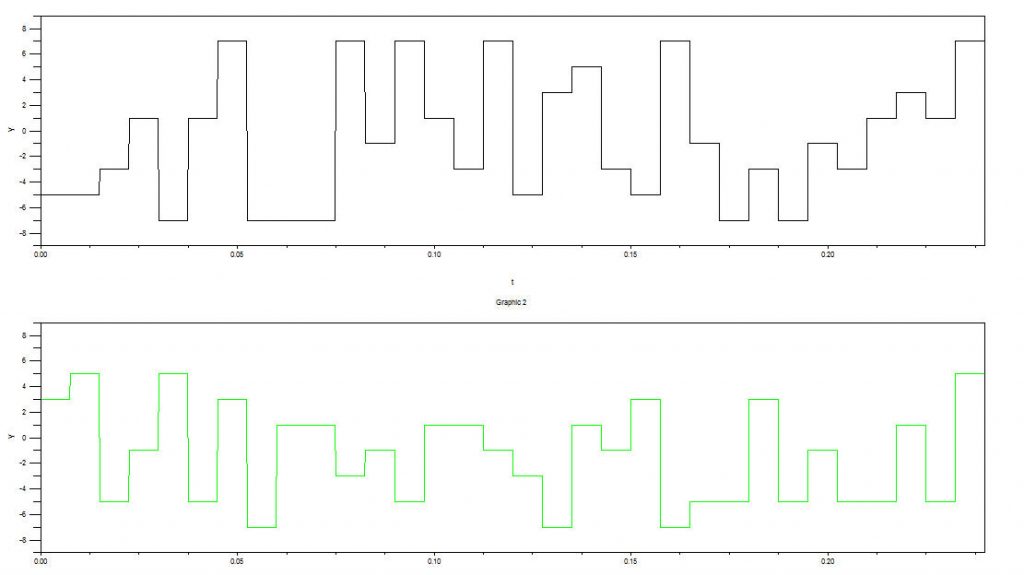
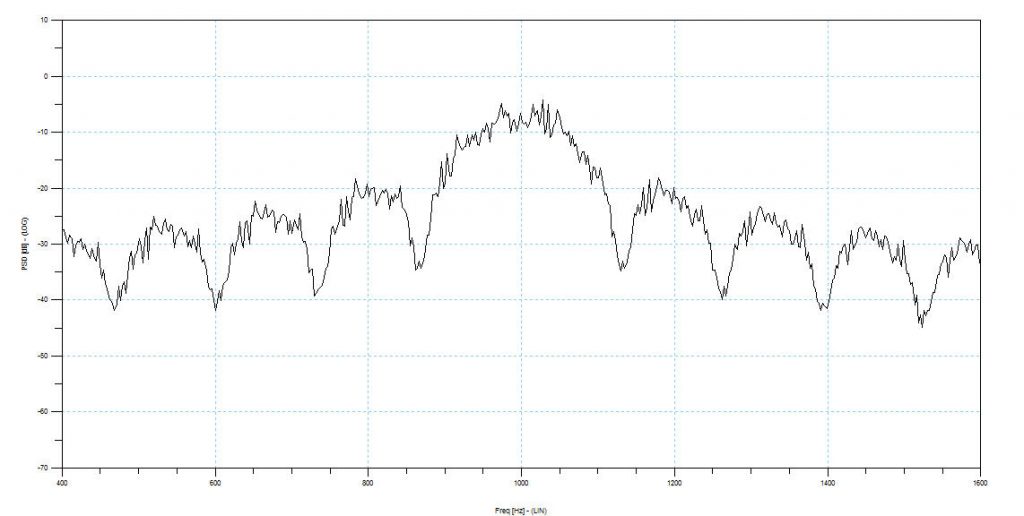
Figure 3 shows the output of the Random Integer Generator. It produces 64 possible outcomes from 0…63. Figure 4 shows the I & Q Amplitudes for each random integer from the generator. Each outcome lasts for 1 baud of 7.5msec. Table 1 shows the assignment of I & Q Amplitudes for the corresponding state of the Random Integer Generator. The I output amplitudes multiply cos(wct) and the Q outputs multiply sin(wct). These two streams are added together to form the 64QAM output as shown in Figure 5. Figure 6 shows a closeup of the waveform, where amplitude and phase changes are clearly visible. Figure 7 shows the output spectrum. Note the output spectrum has a first null at Fc +/- BaudRate = 1000Hz +/-133.3Hz.


| Random Integer Generator | I Amplitude | Q Amplitude |
| 41 | -5 | 3 |
| 50 | -5 | 5 |
| 10 | -3 | -5 |
| 28 | 1 | -1 |
| 48 | -7 | 5 |
| 47 | 1 | -5 |


In order to see the difference between a multilevel modulation scheme and a plain data stream, Figure 8 shows a 2 Level Pseudo Random Bit stream feeding an I modulator cos(wct) at the same frequency Fc = 1000Hz. The bit rate is the same as before R = 800bit/sec. Figure 9 shows the random data, the carrier wave and the modulated carrier wave. Data shifts from “0” to “1” cause a 180deg phase shift. Figure 10 shows the modulated output spectrum. Note the first null bandwidth = Fc +/-800Hz. So we can see the advantage of a multilevel system. In 64(2^6)QAM we require 1/6th the bandwidth or 133.3Hz.
The price we have to pay for reduced transmit bandwidth is a far more complex receiver that has to distinguish between 8 amplitude levels of I and Q, vs. just two levels. Also we have to use highly linear amplifiers with power back-off to avoid inter-modulation and distortion caused by the huge variation in amplitude.


Figure 11 shows a 64QAM receiver. Random channel noise is added to the input 64QAM signal which is then multiplied by the recovered I & Q carriers. The noisy I & Q data streams feed 8 level comparators to recover the original data. Figure 12 shows the received eye pattern. This can be imagined as visualizing the tip of the received QAM vector plus a random noise vector. As noise becomes excessive, the boundaries between the various constellation points becomes blurry and receiver errors start to occur. Any phase hits caused by frequency translation > 7.8 deg will also cause errors.


Please send your comments, questions and suggestions to:
contact:

References
#1. “LTE and the Evolution to 4G Wireless: Design &Measurement Challenges”, Agilent Technologies 2009, ISBN 978-988-17935-1-5
#2. ScicosLab with Modnum Toolbox
https://www.scicoslab.org
#3. “Learn Telecommunications by Simulation” EBook
https://www.clarktelecommunications.com/simulation.htm
#4. “HF High Frequency Radio Telecommunications Learn by Simulation” EBook
https://www.clarktelecommunications.com/simulation.htm