Long-Term Solar Photovoltaics Penetration in Single- and Two-Family Houses in Switzerland

1
Paul Scherrer Institute, Energy Economics Group, Villigen 5232, Switzerland
2
Swissgrid AG, Ancillary Services and Analytics, Aarau 5001, Switzerland
*
Author to whom correspondence should be addressed.
Energies 2019, 12(13), 2460; https://doi.org/10.3390/en12132460
Submission received: 14 May 2019
/
Revised: 21 June 2019
/
Accepted: 24 June 2019
/
Published: 26 June 2019
(This article belongs to the Special Issue Climate Changes and Energy Markets)
Abstract
:The Swiss energy strategy aims at increasing electricity generation from solar power by 2050, to fulfil Switzerland’s commitments in the Paris Agreement. However, the market of single- and two-family houses is characterized by low return rates for excess power injected to the grid, and the installation of rooftop solar photovoltaic (PV) is sensitive to financial incentives. We assess the drivers influencing the diffusion of rooftop solar PV systems until 2050, by employing an agent-based model. An agent is a single- or two-family house, and its decision to invest depends on the economic profitability of the investment, the agent’s income, environmental benefits (injunctive social norm), awareness and knowledge about the solar PV technology, and the impact of the social network (descriptive social norm). The model includes a synthetic population of agents, statistically equivalent to the true population. We also investigate the impact of different support policies, technology learning rates, electricity prices, and discount rates on the investment decision. We find that the concept of prosumer emerges, mainly via self-consumption strategies. The diffusion process of rooftop solar PV systems in single- and two-family houses gains momentum in the future. In the near-term, PV deployment is sensitive to the profitability of the investment, while after the year 2030, peer effects play an increasing role in the agents’ investment decisions.
1. Introduction
In the Paris Agreement Switzerland has committed to reducing its greenhouse gas emissions by 50% in 2030 compared to 1990 levels, with the long-term goal of 70% to 85% in 2050 [1]. The Swiss energy strategy prohibits the commissioning of new nuclear power plants, and it promotes renewable energy and efficiency [2]. Much of the additional exploitable renewable potential comes from rooftop solar PV [3], for which Switzerland implements support policies that encompass feed-in tariff and capital subsidy schemes [4]. In 2019, the solar PV installations of less than 100 kW were eligible only for the capital subsidy, while installations above 50 MW were eligible only for the feed-in tariff. Installations between 100 kW and 50 MW can choose between the two support schemes. The feed-in tariff was 10 Rp/kWh in 2018 (1 CHF = 100 Rp. = 0.88 EUR in 2018).The guaranteed period of the tariff payment for PV installations was 15 years. The calculation of the investment subsidy, in Swiss francs (CHF), was based on the formula 1400 + 340 x (kWp) for installations less than 30 kWp, and 1400 + 300 x (kWp) for installations larger than 30 kWp.
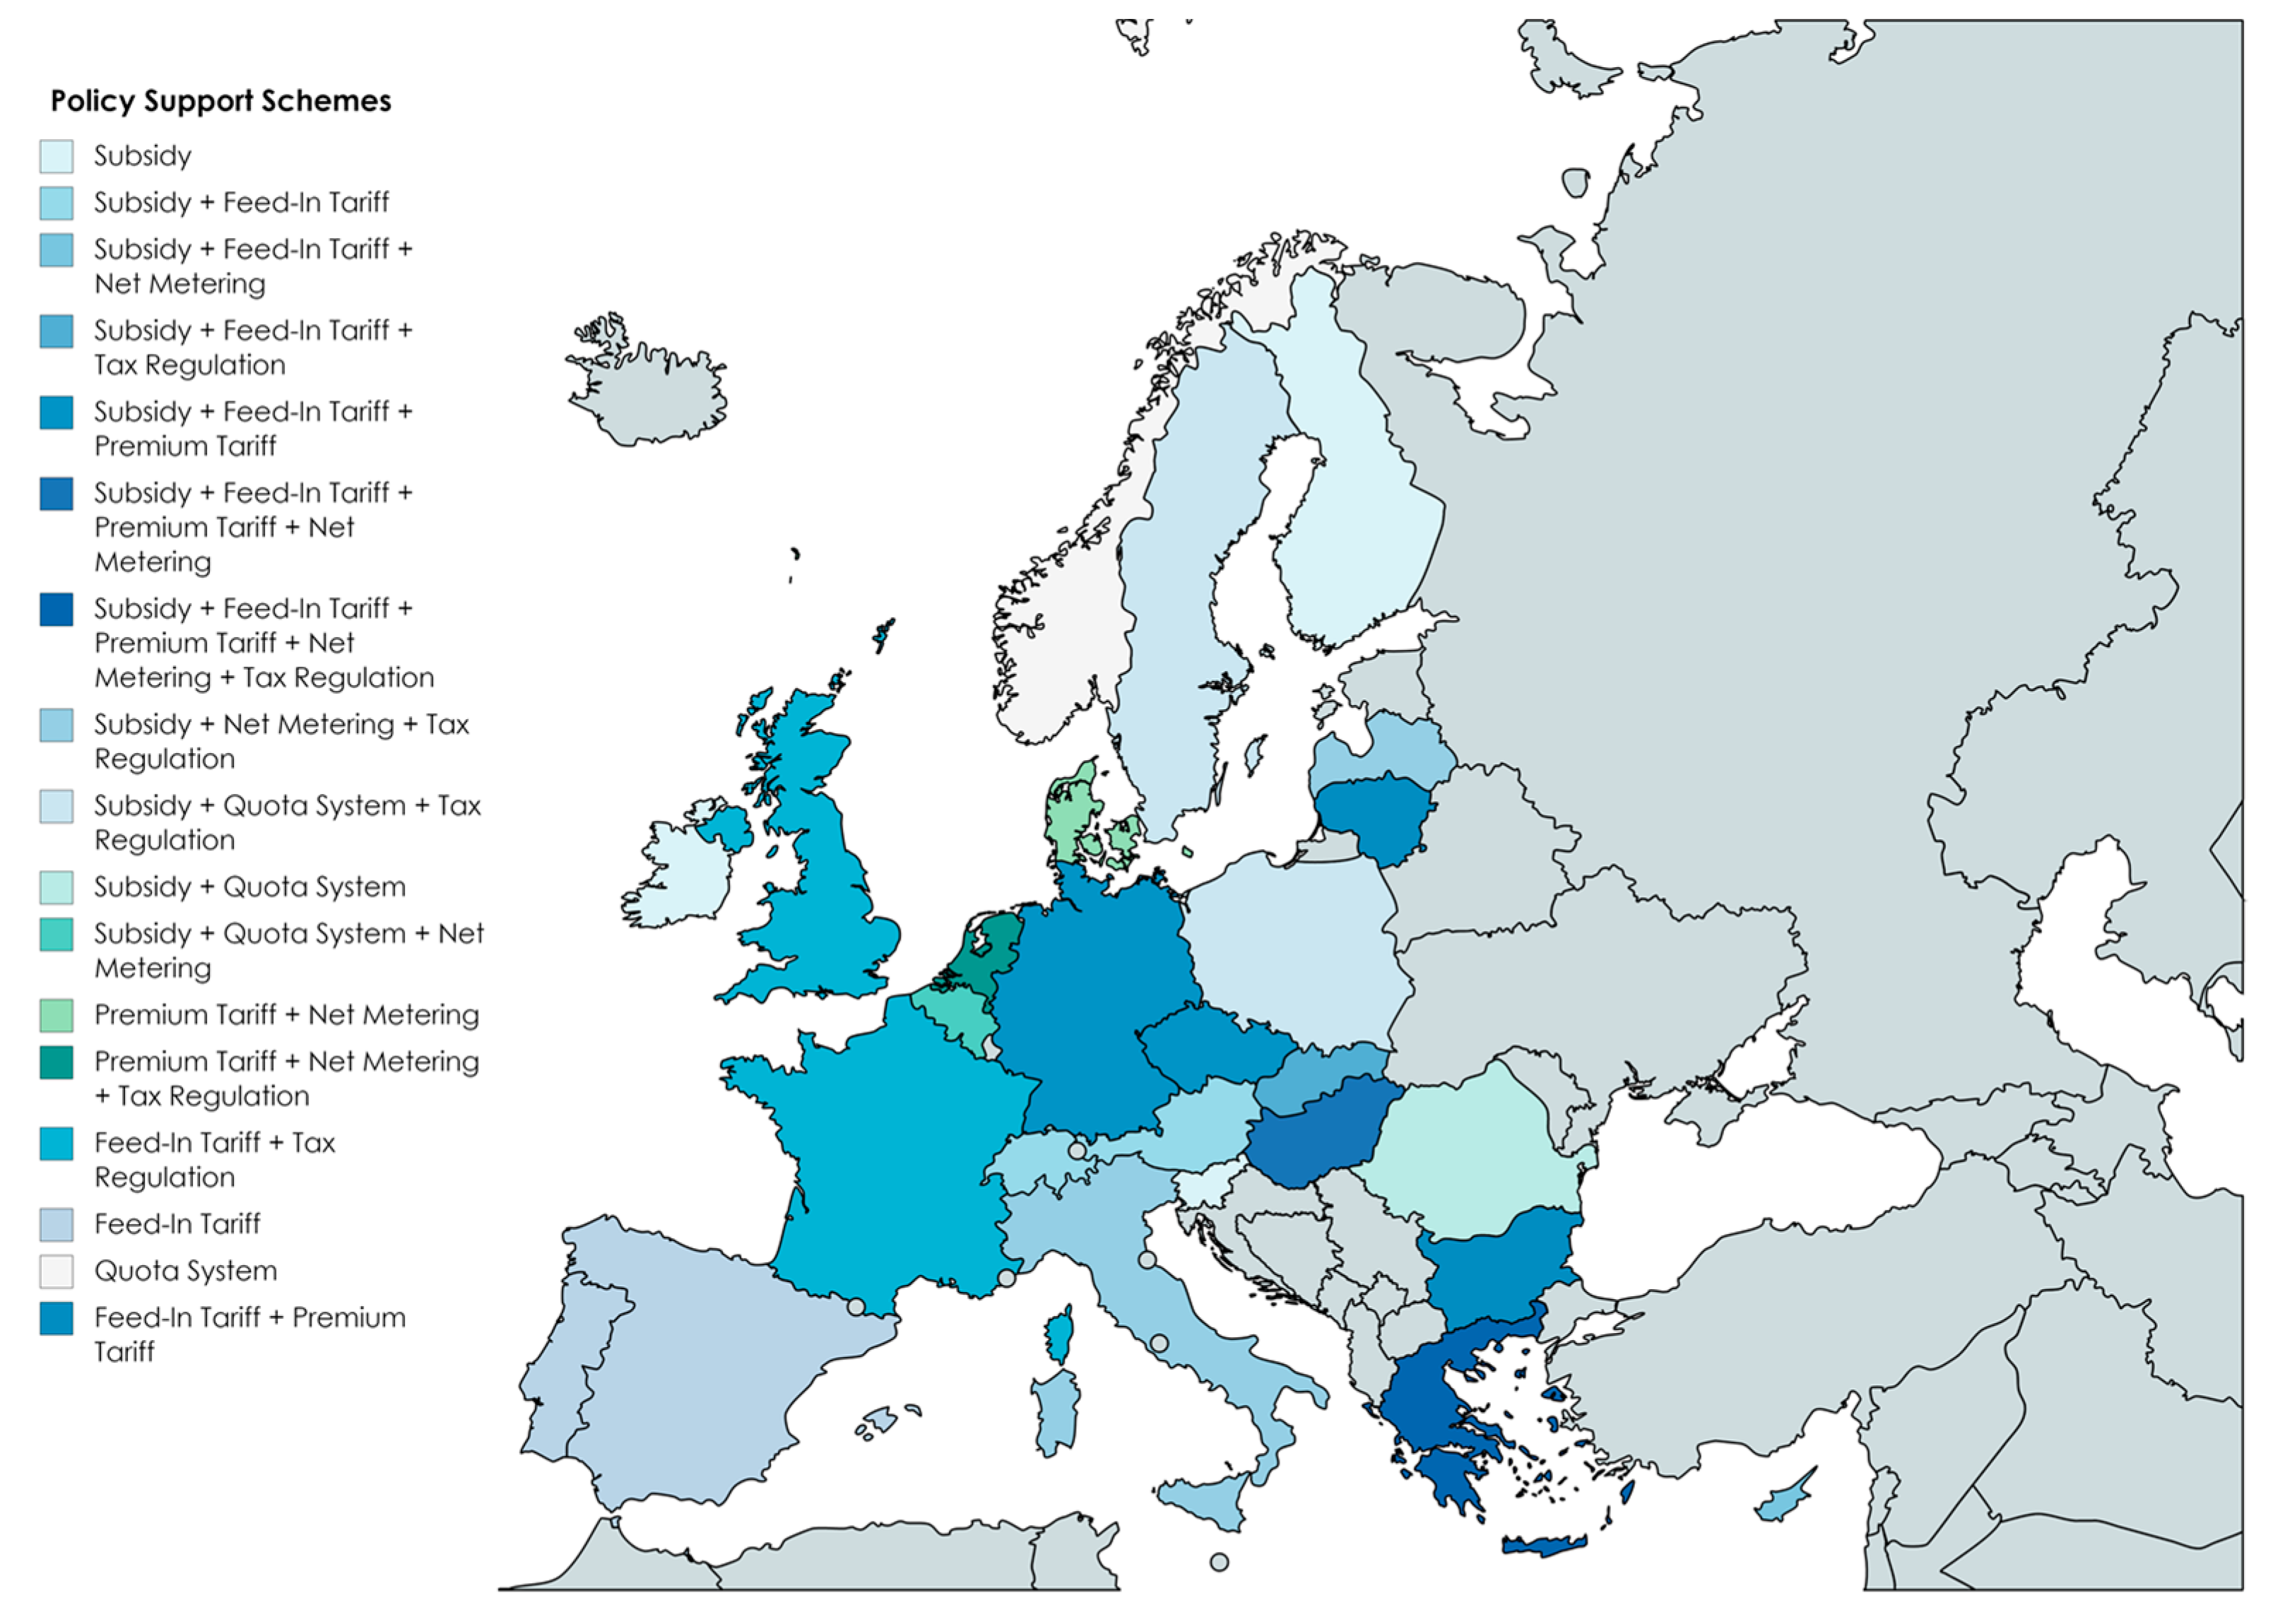
Similar support schemes are applied in other European countries as well, as shown in Figure 1 (based on the Renewable Energy Policy Database—RESLegal [5] for the year of 2017).
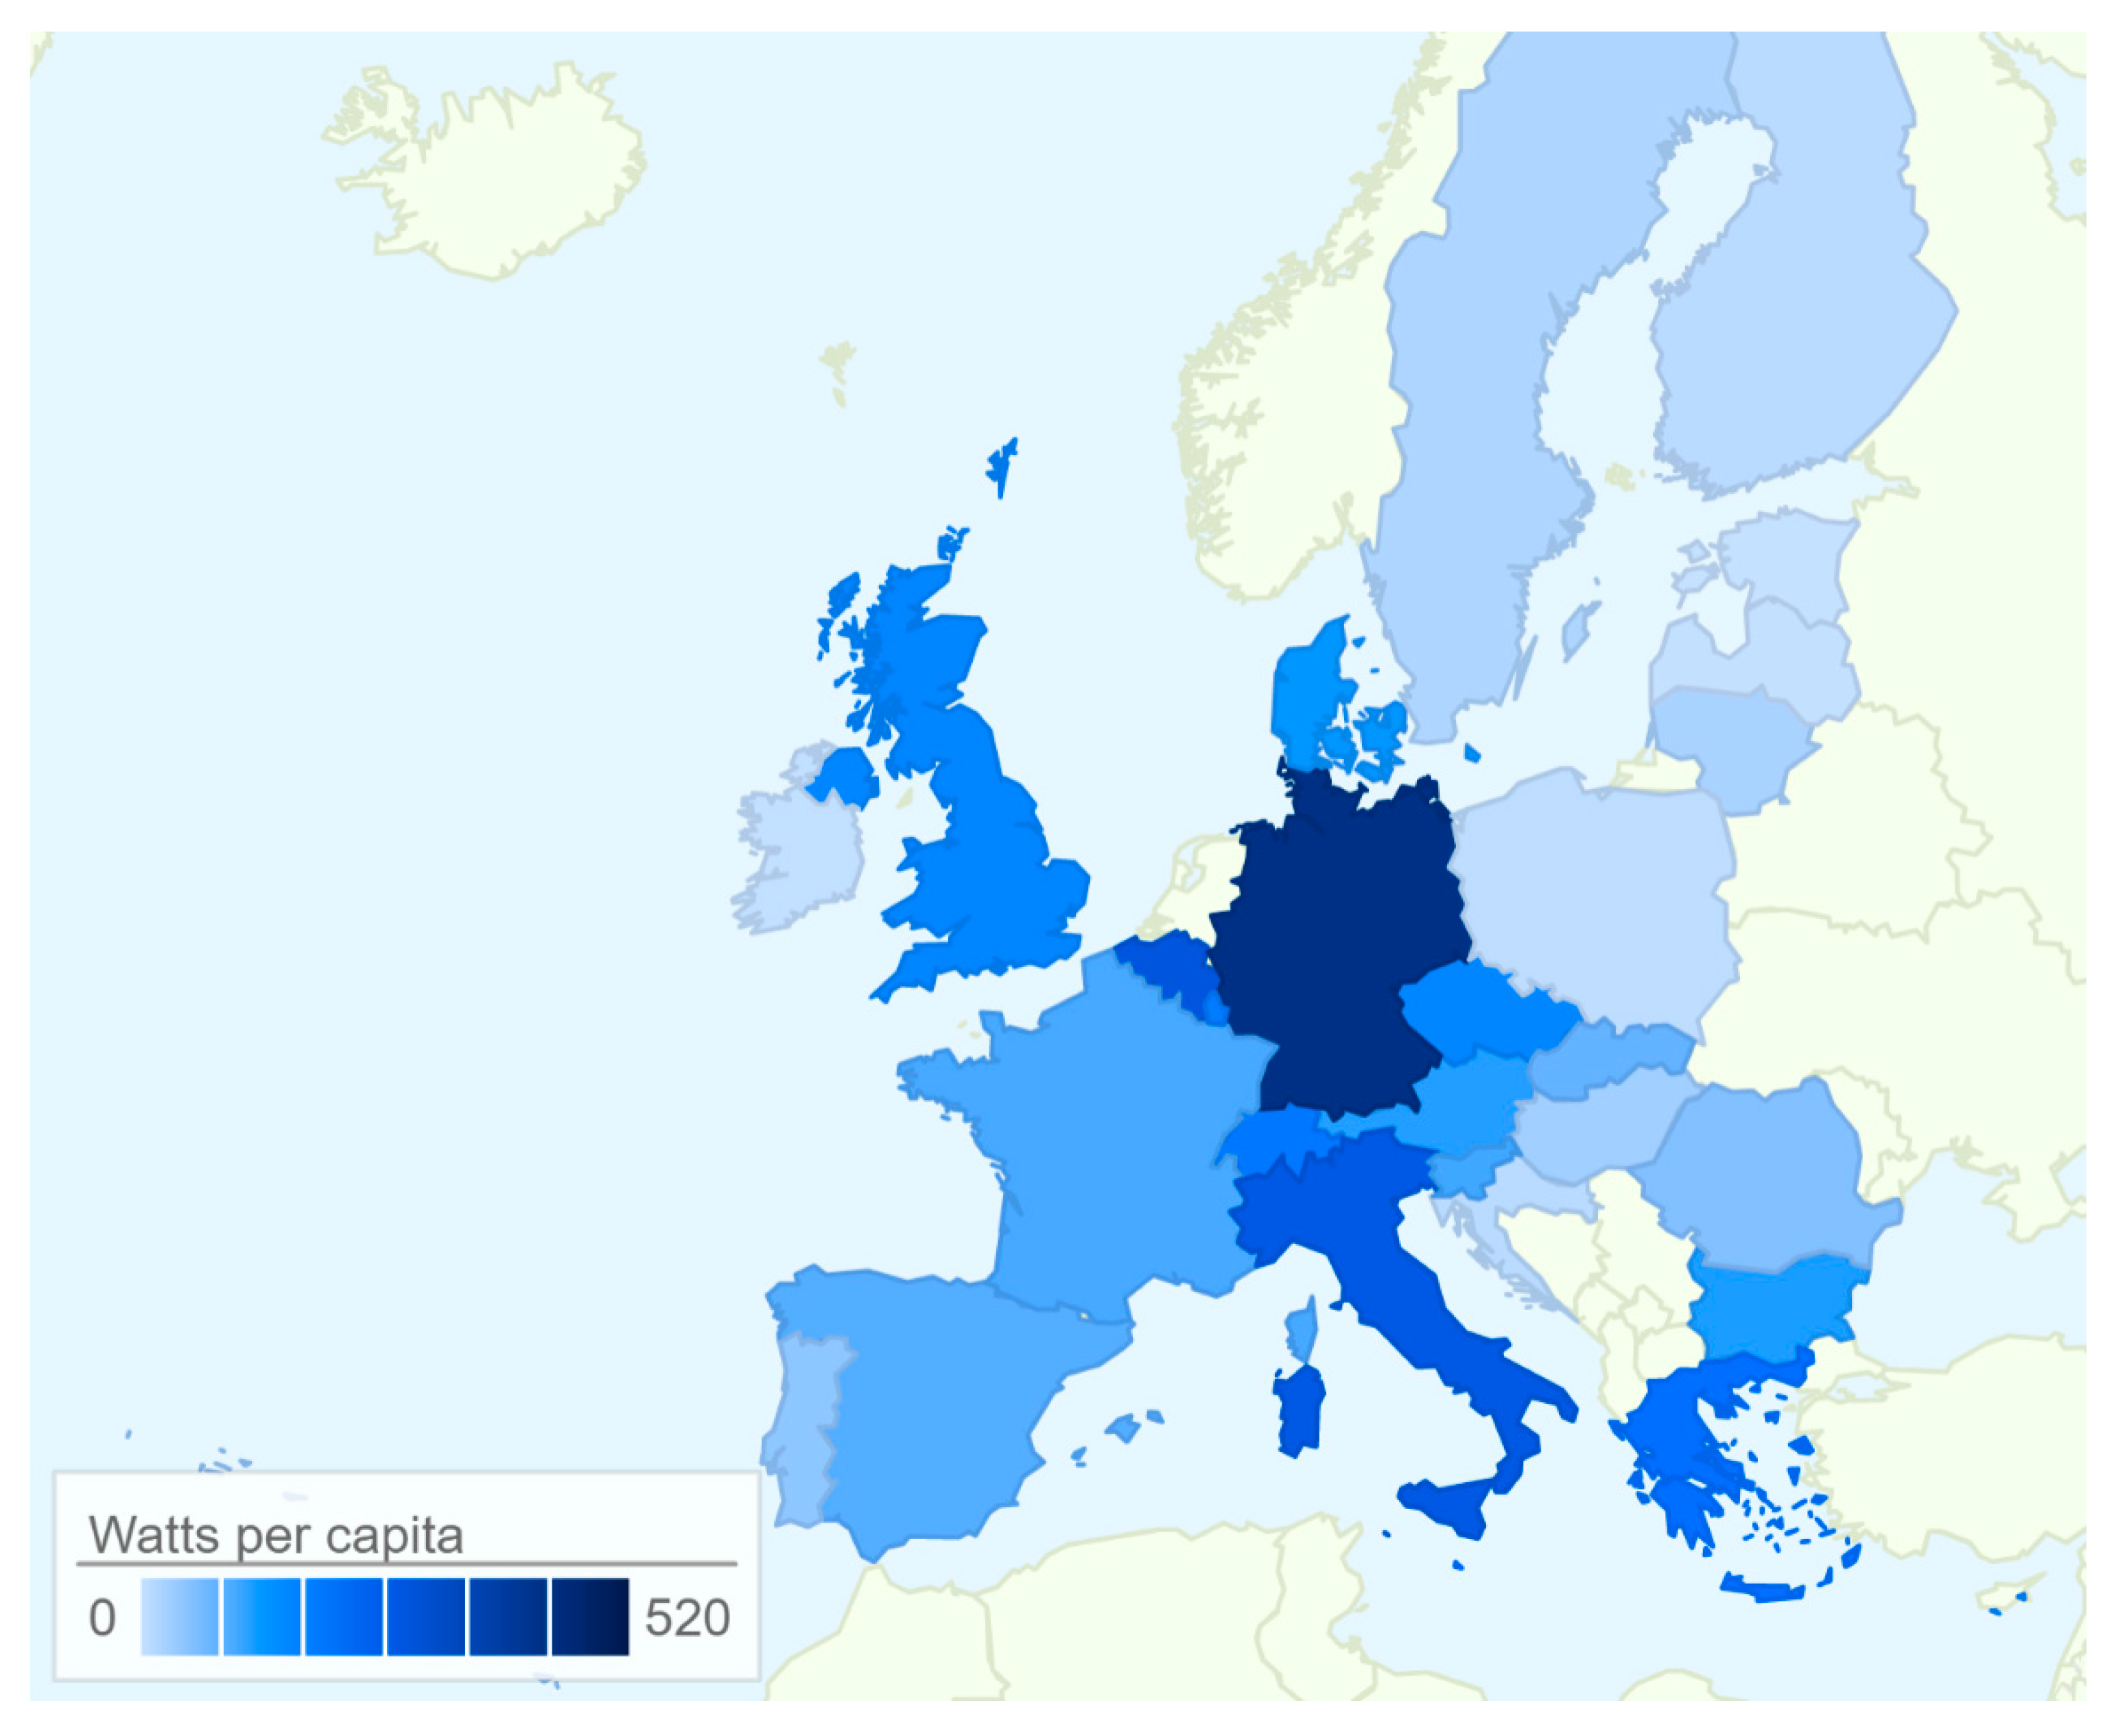
Regarding the diffusion of the solar PV systems (both rooftop and ground-mounted), Switzerland is slightly above than the EU average in terms of watts per capita (Figure 2). In 2017, the total installed solar PV capacity in Switzerland was 1.9 GWp [6], which translates to 0.23 kW per capita. For comparison, the EU average is 0.21 kW per capita in the same year. Among the European countries, Germany has the highest installed solar PV capacity per inhabitant (0.51 kW), followed by Italy (0.34 kWp), Belgium (0.33 kW) and Greece (0.25 kW) [7].
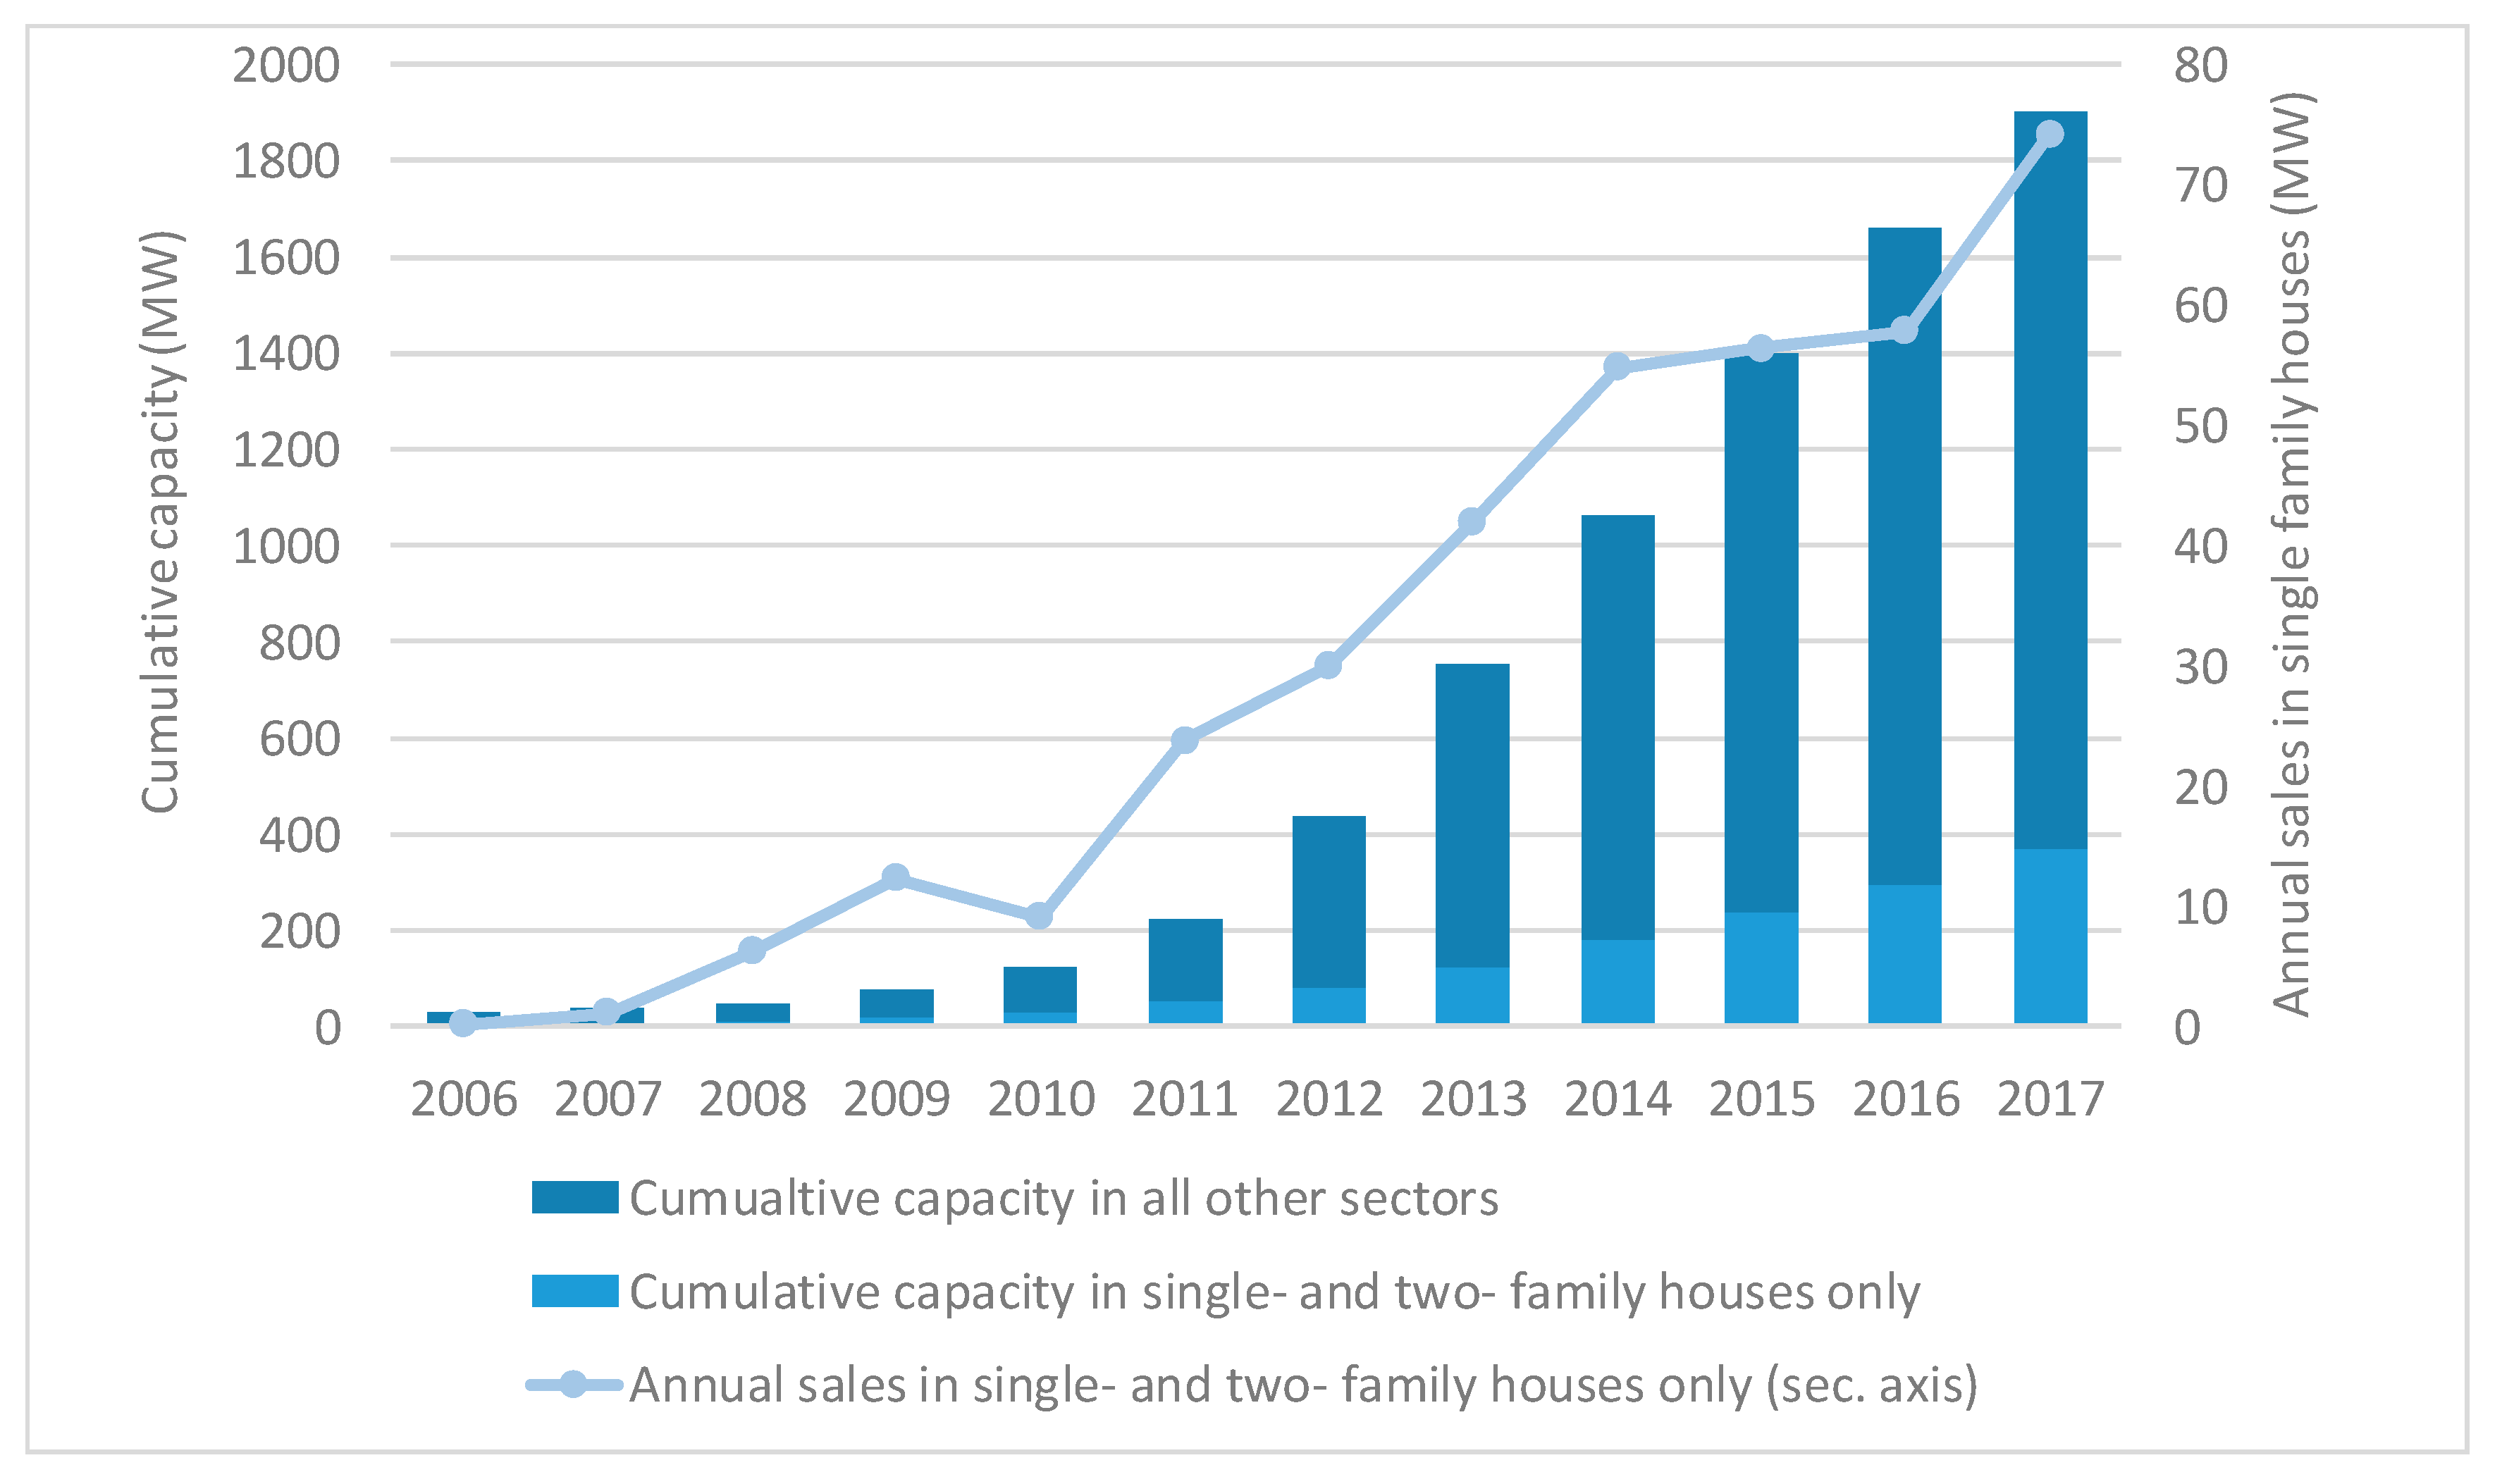
Accelerating the deployment of solar PV systems on residential buildings is claimed as an effective decarbonization strategy [2]. However, the market of single- and two-family houses in Switzerland has shown a deceleration of the annual sales of solar PV systems between 2014 and 2016 (Figure 3), mainly attributable to the revision of the policy. As there are low return rates for excess power injected to the grid, system owners dimension their PV systems as small as possible to optimize their consumption. Given that the single and two-family houses constitute more than two thirds of the residential building stock in Switzerland [8], it is crucial to increase the adoption rate of solar PV technology in this sector to meet the climate change mitigation objectives (see for example [9]). Hence, the importance of single- and two-family houses in achieving a low-carbon energy system and the dependence of this particular market segment on the level and type of policy support [10], constitutes an interesting case study to examine and understand the dynamics of the adoption (i.e., investing) of the solar PV technology.
The decision to invest in a solar PV system depends on multiple factors. For example, different time preferences of money and risk stances of the (potential) investors in a solar PV system, which are captured via the weighted average cost of capital and discount rates, may render the investment financially unattractive [11] and defer it. On the contrary, social influence (peer effects), the environmental sensitivity of the individuals, and their knowledge about the technology can positively influence the decision to invest [12,13,14]. In [14], a survey was conducted for Switzerland in a dataset of 408 homeowners, and it was found that also aesthetic aspects of solar panels play an important role in expanding the customer base. Moreover, the intensities of different support policies and technical progress play a significant role in investment decisions [10]. While solar PV technology is a mature technology, there are still barriers to increasing its adoption rates. A range of studies, based on qualitative analysis and interviews with experts, have already assessed the most important of them. For example, in [15] adopter-specific and institutional barriers are identified for Switzerland, such as high initial costs, high product complexity, low awareness and knowledge regarding the technology, as well as political risks that might arise due to unreliable policies. The same study also finds that social norms play an important role in explaining PV adoption decision and diffusion patterns, which is a finding similar to other studies for other world regions. For example in [16] a survey in California also found that installers and neighbors play important, often supplementary, roles in the decision-making process, and have an influence on both the decision to adopt and the mode of adoption (e.g., purchase versus leasing). Installers and experts can help to lift the barriers related to adoption, via expert advice and provision of realistic information about costs and energy that can be produced, as shown in a survey from Finland [17].
To quantify the key drivers and barriers affecting the diffusion of the rooftop solar PV systems in Switzerland, and especially their dynamics over the time, we apply an agent-based model (ABM) that simulates the decision process, the actions, and interactions of autonomous agents. An agent is a single- or two-family house in Switzerland, with main attributes its location (at a Cantonal level), income, average age, and education level of the adults in the house, social status, average annual electricity consumption, expected annual production from a solar PV system, and usable rooftop area. The decision mechanism is based on a utility function, which considers the financial attractiveness of the investment, the income of the agent, its environmental sensitivity, awareness, and knowledge about the solar PV technology, as well as social norms. Two social norms are modeled, the descriptive social norm (i.e., peer effects from e.g., seeing more solar PV installations in the neighborhood or influence from increased social links with adopters) and the injunctive social norm (i.e., the perception that the adoption of a PV system is the right thing to do for the environment) [18]. While the peer effects are modeled through the social network component of the model, the injunctive social norm is approximated via a partial utility function. The model represents a synthetic population of more than one million agents, and it runs on an annual basis from 2009 to 2050, with the years 2009–2017 being treated as model calibration and validation datasets.
ABMs are widely used to simulate the inherent complexity of adoption and diffusion process of various energy technologies [19]. For example, ABMs have been applied to assess the technology penetration of micro-generation in the Netherlands [20], plug-in hybrids in the USA [21] and China [22], heat pumps in the UK [23], energy-efficient technologies in households in various world regions [24] and in the UK [25], smart metering [26], electric cars in Ireland [27] in the USA [28] and in Germany [29]. The assessment of the adoption of residential solar PV systems with an ABM is examined in a few studies. For example, the impact of different governmental incentives in the USA is evaluated by using a weighted utility function to model the investment decision of the agents [30]. In [31], a model based on behavioral rules and the theory of planned behavior [32] is applied to assess the penetration of solar PV at the city of Austin in Texas. In [33], a data-driven ABM is implemented to evaluate the diffusion of solar PV in California. In [34], geospatial information is taken into account to forecast the adoption of solar PV systems in California, but the study does not develop an ABM system. Also, for California, ABMs employing GIS [35] and social behavior [36,37] methodologies have been applied as well. In [38], an ABM with the geographic information system and logistic regression has been developed to simulate the adoption of the rooftop solar PV system in a district of Gangnam in South Korea. In [39], an ABM based on logistic regressions with explanatory variables the payback period, eco-friendliness, budget, and peer effects is developed to assess the diffusion of solar PV in Germany. Another study looked at the penetration of solar PV systems in single-family houses in Italy, using a weighted utility function to model the decision based on income, economic and environmental benefits, and communication as partial utilities [40]. In [41] an ABM is proposed which uses self-reported data and then it is empirically tuned using historical data, in order to study the adoption of solar PV panels in private households in the Emilia-Romagna region in Italy. In [42] an ABM is employed to study and contrast the adoption of solar PV and battery systems (combined) in both Ontario, Canada, and Bavaria, Germany, using weighted utility function that includes budget, payback period, environmental sensitivity, social influence, and emotional impressions of PV systems. In [43] an ABM is described to explore the impact of installers of PV panels on the adoption rate of PV technology in the residential sector, focusing on the maximization of the installers’ profit (while buyers only evaluate the financial viability of their investment before adopting the technology).
We apply the methodology presented in [30,40], based on the concept of maximizing a weighted sum of partial utilities representing different decision factors, which we extend in the present study by including: a) dynamic growth of the agents’ population over time; b) changes of key agents’ attributes over time, such as income, age, and electricity consumption; c) optimization models for each agent to decide the support scheme (capital subsidy or feed-in tariff) when applicable; d) a large number of agents based on synthetic populations using Monte Carlo sampling. In our framework, we capture the most influential factors affecting the decision to invest, as these have been identified in the literature. We include economic drivers, budgeting constraints and access to capital, descriptive and injunctive social norms, climate conditions, technology performance, policy schemes and market configurations. We compensate the lack of using surveys and geographical systems with the large sample of agents we include in our analysis and the statistical equivalence of our synthetic population to the actual (and unobserved) population of agents. Thus, the novelty in our approach is that we include the major influencing drivers regarding the decision to adopt a PV in a flexible framework that only requires access to open data published by administrative registers, without the need for conducting a census for a large share of the population. To the best of our knowledge, the ABM applied in this study is the first of its kind that quantitatively assesses the diffusion of solar PV systems in single- and two-family houses in Switzerland. The model can also be extended to include additional solar PV markets, e.g., multi-family houses.
The next section presents the description of the model and its calibration and validation procedures. Section 3 presents results from different scenarios and sensitivity analyses regarding policy support schemes, technology performance, electricity prices, and discount rates. We conclude with policy implications of our analysis and suggestions for extending the current work.
2. Materials and Methods
2.1. Description of the Agent-Based Model Implemented in This Study
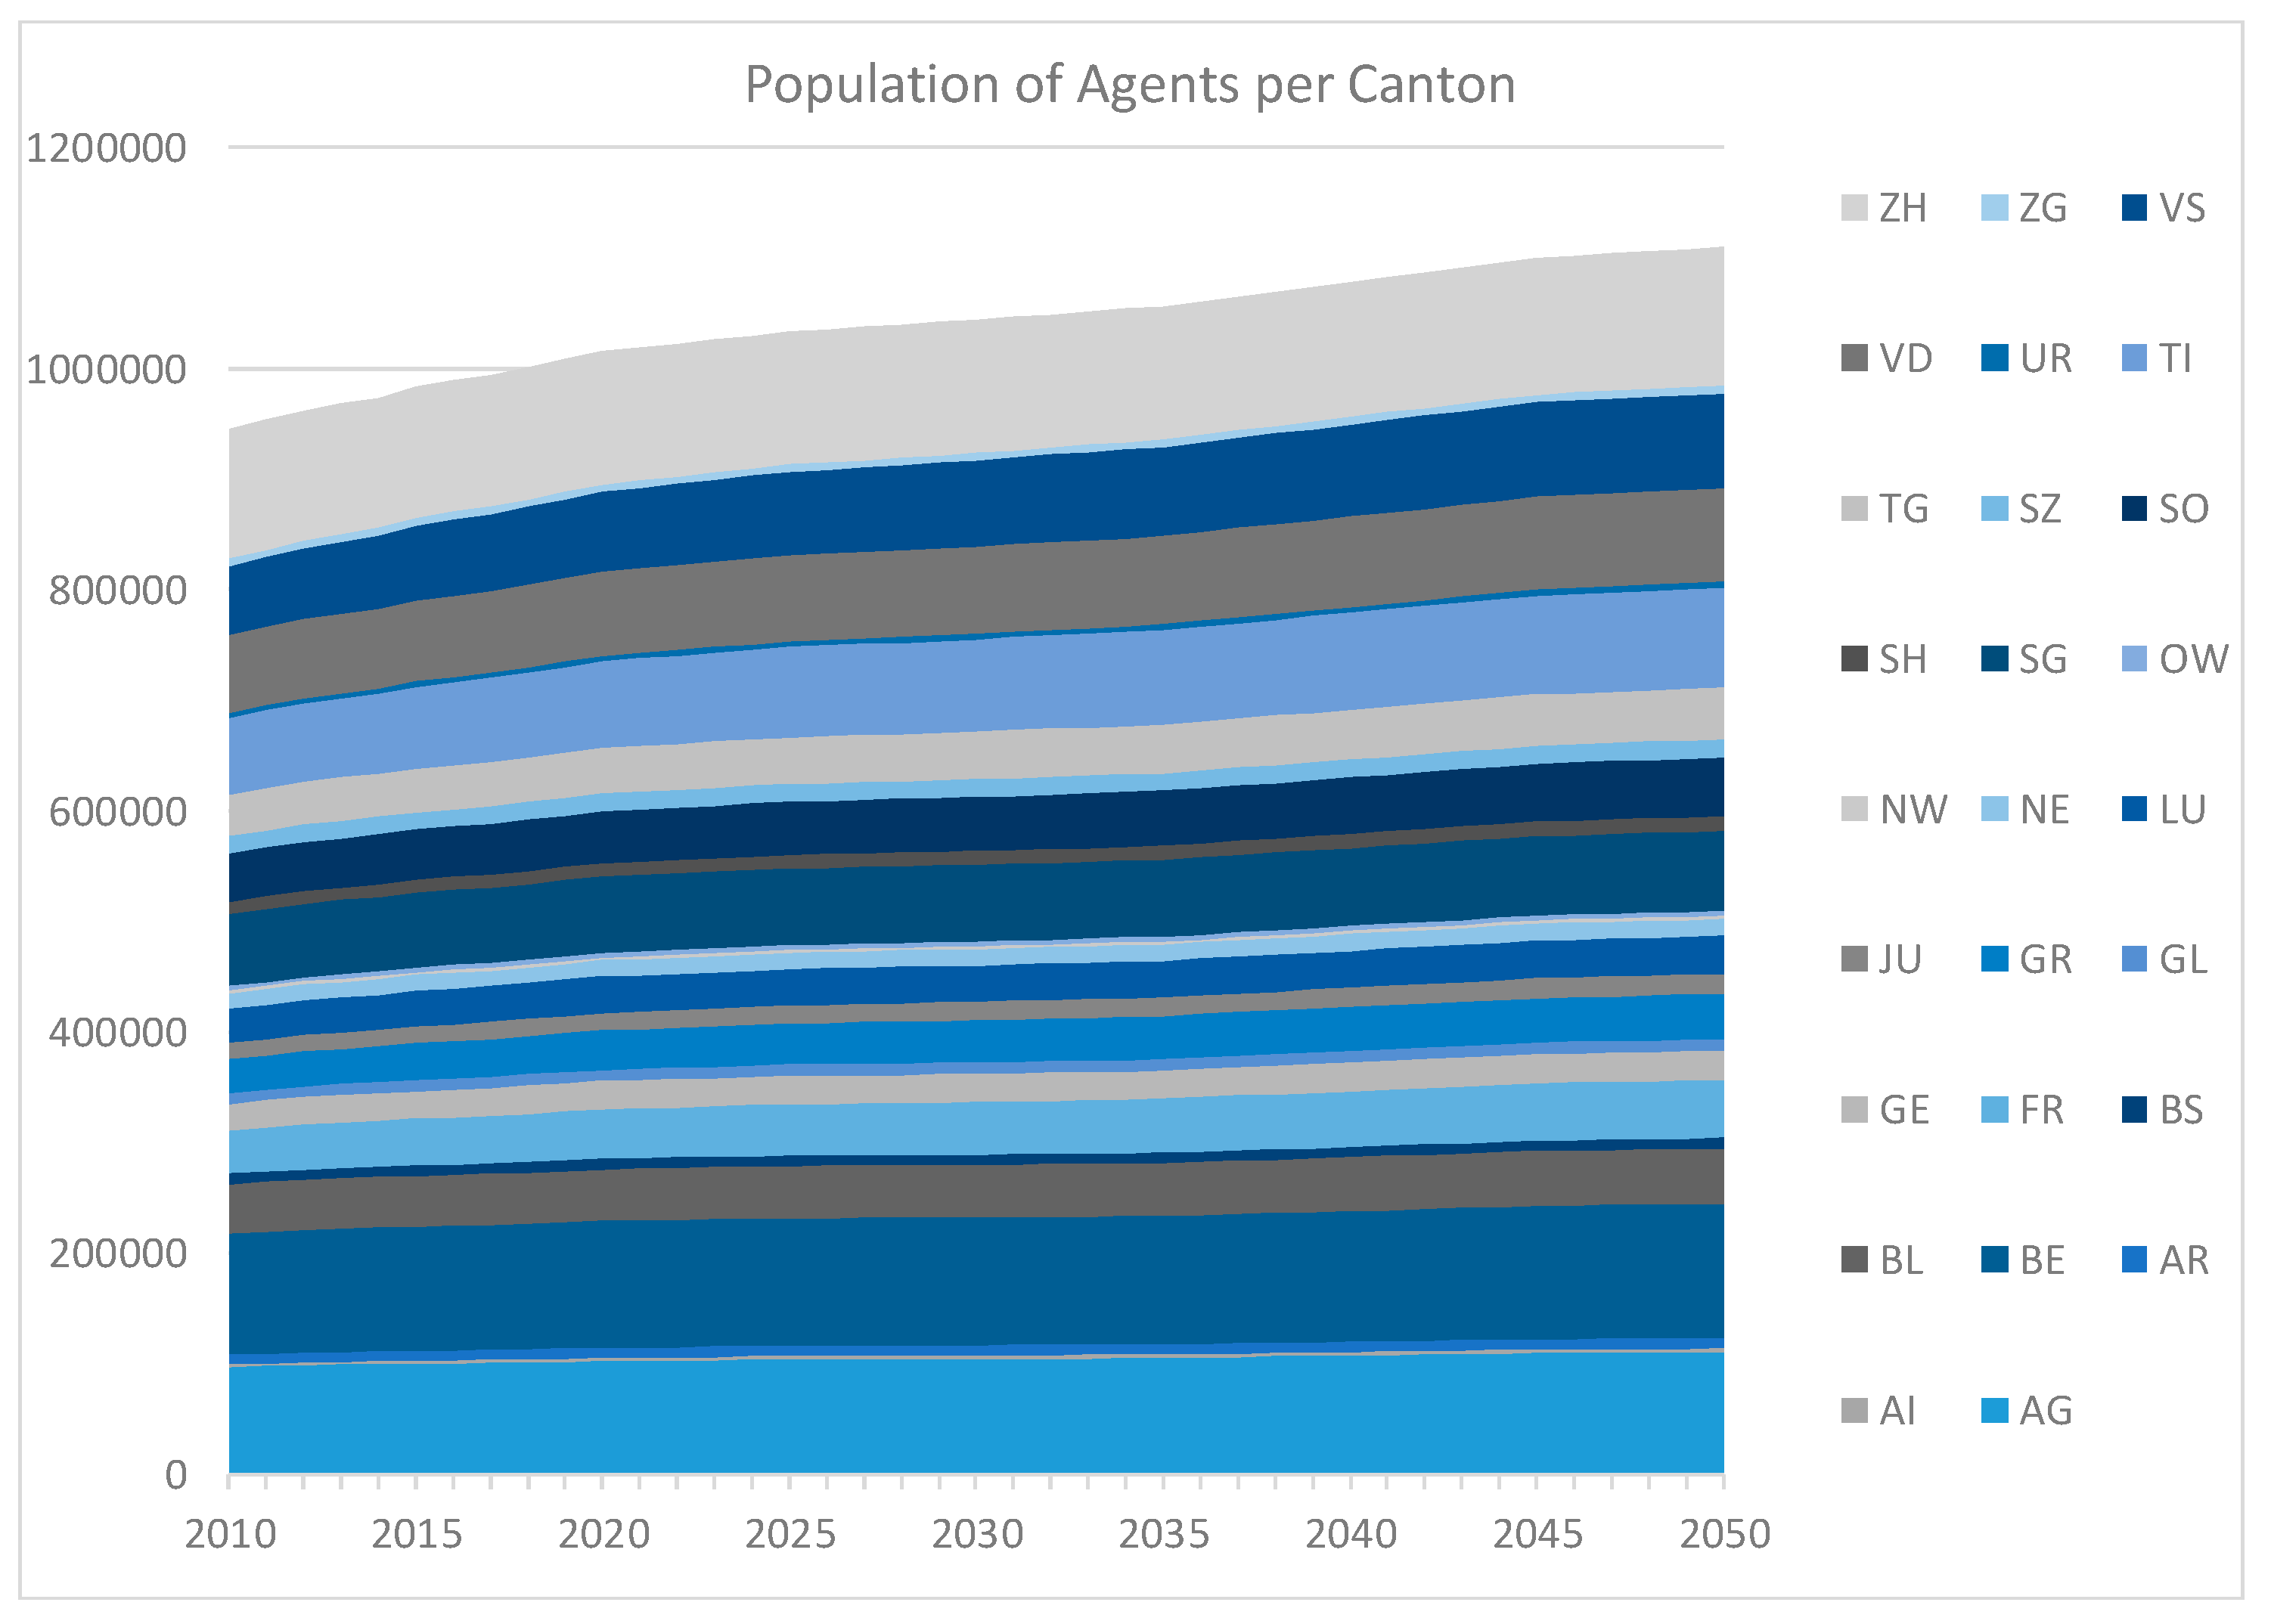
An agent in the model is a single- or two-family house located in one of the 26 Cantons of Switzerland. An agent can install a solar PV system of any size, with its usable rooftop area being the main technical constraint. The attributes used to identify an agent is the household income, average age, and education levels of the adults of the household, socioeconomic status, annual electricity consumption, location of the house (Canton of residence), usable rooftop area, and expected annual electricity production from the installed solar PV system. The population of the agents is dynamic over time. The starting number is 934,260, equal to the total number of single- and two-family houses in 2009 [8], and exogenously increases to 1,137,077 in 2050, according to the population and household assumptions in the Swiss energy strategy scenarios [44] (see Figure 4).
We assume that solar irradiation in each Canton remains constant throughout the projection horizon (i.e., we do not include weather effects). This assumption implies that the expected annual production from 1 kWp rooftop solar PV system installed by an agent located in a given Canton in Switzerland remains constant from 2009 to 2050. To estimate the annual production from 1 kWp solar PV in each Canton, we use the database of [45] by applying optimal values for the orientation and inclination of the installed system and by using the irradiation levels of a reference location: either the Canton’s capital or the most populous city (see Figure A1 in Appendix A).
Within the social system of the model, agents of similar behavior and socioeconomic status are grouped into different socioeconomic categories. Following [40,46], we categorize the heterogeneous population of agents according to the Sinus-Milieus® register [47], by using open data for Switzerland [48] (see also Figure A2 in Appendix A). The Sinus-Milieus® is a scientific model to classify people according to life and ways of living and contextualize them with the socioeconomic status indicated by education, age, profession, and income. We then map the social classification categories of Sinus-Milieus® to the different types of adopters based on [49] (an adopter is an agent that adopts the technology, i.e., a single- or two-family house that invests in rooftop solar PV). Table 1 presents the mapping of the internal Sinus IDs used in the model to the actual Sinus-Milieus® categories, together with the mapping of the categories to the different types of adopters.
Because the social network is dynamic over time (since people’s preferences may change with the age, and the growth of income may alter lifestyles and the socioeconomic status), we apply the trends in the allocation of the population to the Swiss Sinus-Milieus® socioeconomic categories from 2005 [50] to 2016 [51] to approximate changes in the social and lifestyle preferences until 2050. Figure 5 presents the classification of agents into the different Sinus-Milieus® categories over time.
2.1.1. Creating the Synthetic Population of the Agents
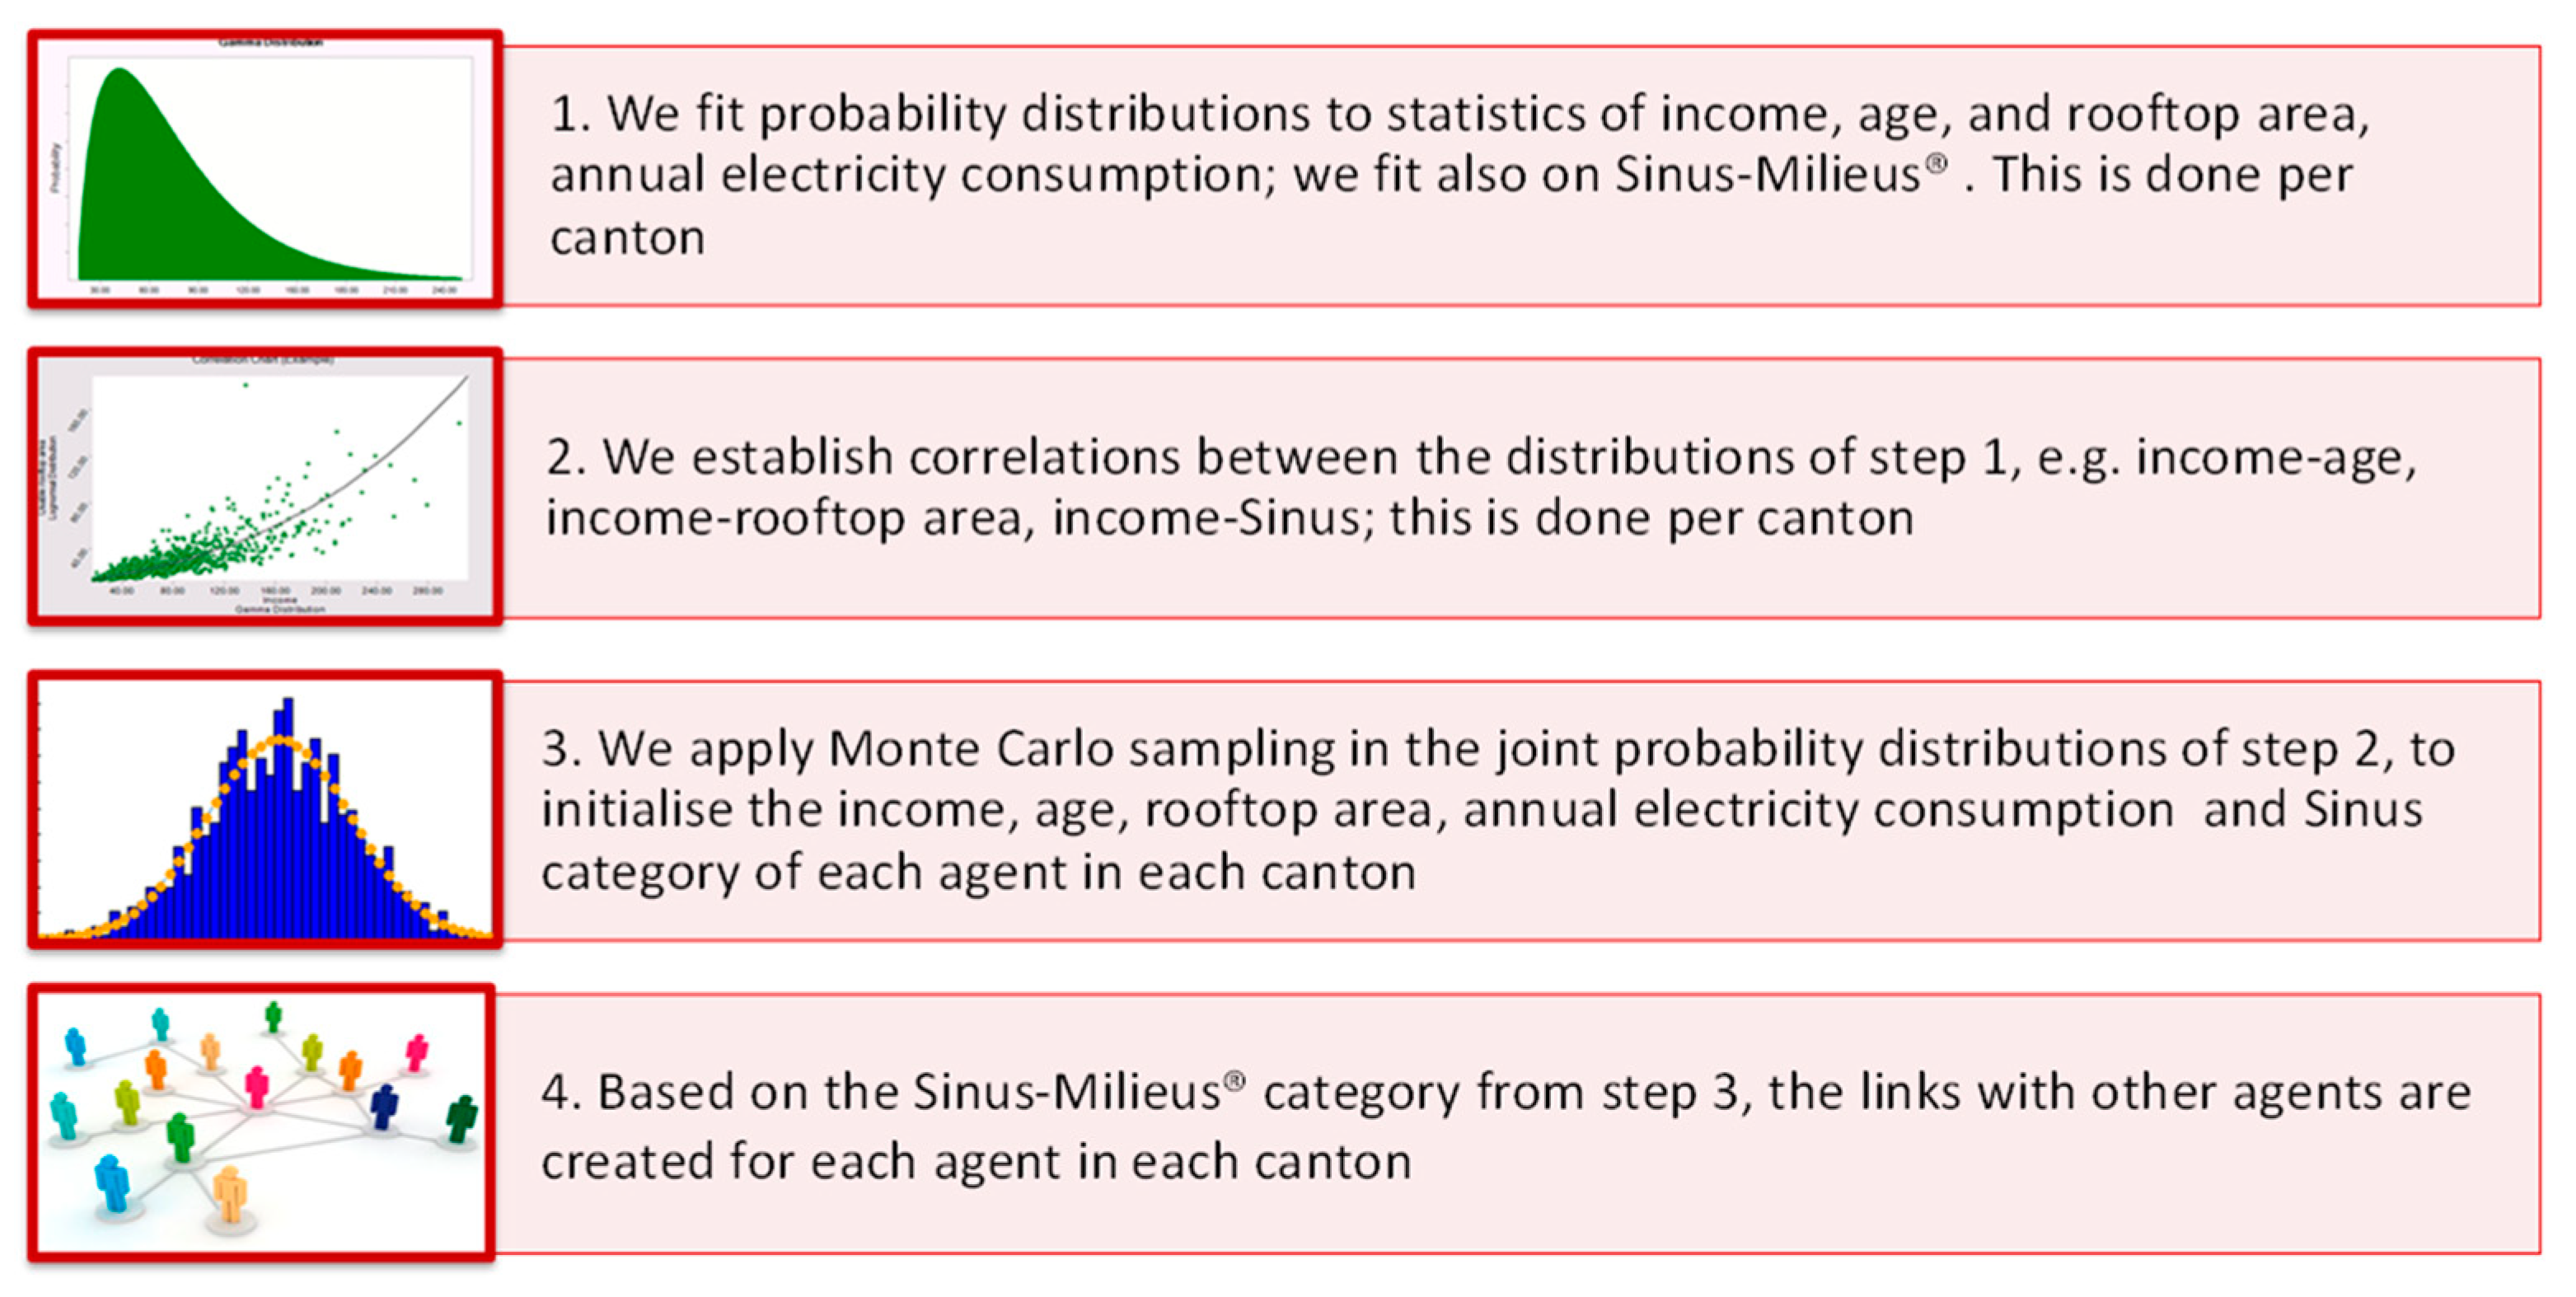
The initialization of the agents needs data at the micro level, which is usually not available for data privacy and security reasons. Conducting a census for a large share of the population is a challenging task because of the size and cost required to have comprehensive and detailed data. We, therefore, generate a synthetic population of agents using publicly available data from administrative registers. The synthetic data solve the issue of privacy and statistical risk disclosure. It also allows the fusion of data from multiple sources and types, thereby creating datasets of particular relevance for modeling and simulation. For the characterization of the agents, we generate multi-dimensional datasets from one-dimensional probability distribution functions (PDF) fitted to openly accessible databases. Main data sources are the Swiss Federal Office of Statistics (BFS) [52], the Federal Electricity Commission [53], the Sinus-Milieus®, the SolStis solar PV project database [54] and the Swiss Centre of Expertise in the Social Sciences (FORS) database of social and economic indicators [55]. The multi-dimensional dataset is created by applying Monte Carlo sampling to the fitted one-dimensional PDFs [56], following the methodology described in [57]. The same methodology for creating synthetic populations has been applied to other ABMs, such as in [58] for travel behavior and in [59] for the Multi-Agent Tranport Simulation model (MATSIM) [60]. In [61,62], it was shown that a synthetic population created by synthetic micro-data using Monte Carlo sampling is statistically equivalent to the real population.
During the sampling process for creating the synthetic population, the location of the agent and the annual expected electricity production from 1 kWp solar PV system are considered deterministic variables. On the other hand, the attributes of income, age, Sinus-Mileus® category, annual electricity consumption, and usable rooftop area are random variables. The probability density functions of the random variables of income, age, and usable rooftop area are different per Canton. However, the probability density functions of annual electricity consumption and Sinus-Milieus® category do not depend on the agent’s Canton (mainly due to the lack of data at the time of the study). The income also affects the discount rate of the agent, reflecting different time preferences, access to capital, and risk stances, thus higher incomes are associated with lower discount rates. In this context, the discount rate of the individuals is also a random variable. The fitted PDFs of the random variables and their key quartiles are presented in Table A4, Table A5, Table A6 and Table A7.
To create a synthetic population, first, we determine the number of agents per Canton. Then for each Canton, we sample the joint PDF of the random variables using Monte Carlo sampling, with the length of the sample be equal to the number of agents in the Canton. The sampling process considers correlations between income and age (89%—estimated from [63]), income and rooftop area (85%—estimated from [54,63,64]), income and Sinus-Milieus® category (88%—estimated from [51]), as well as between income and electricity consumption (60%, estimated from [65,66,67]).
A modified version of the Small-World-Network algorithm [68] is applied, in which each agent is connected to everyone else with some degree of separation [69]. The generation of the social network is stochastic. It occurs immediately after the initialization of the agents, and before the simulation starts. There are higher probabilities that an agent relates to agents from the same Sinus-Milieus® categories (see Table A1), similar to the approach followed in [40]. Also, there is a 60% probability that an agent establish a link with another agent from the same location, following a similar methodology as in [35]. Because the population of agents is dynamic, also the total number of agent’s links is dynamic too and depends on agent’s Sinus-Milieus® category (see Table A2 and Table A3). Because the social network is established before the simulation, we avoid static (and perfect foresight) link structures by introducing some “noise”; every year there is a probability that an agent breaks an existing link and connects with another agent (see Table A3), following [40]. This mimics to some extent the real-world dynamics in human relationships.
The methodology for creating a synthetic population of agents is generic enough and allows for creating many populations by repetitive sampling. By creating additional synthetic populations and running the model for each one of them, the uncertainty regarding the structure of the unobserved real population can be quantified, and its impact on the results can be assessed. However, this comes at the cost of increased computational time.
2.1.2. Modeling the Decision of an Agent to Invest
The decision of an agent to invest in solar PV is based on a multi-attribute utility function similar to the one applied in [30,40]. The utility is formulated as the weighted sum of four partial utilities: the financial, the environmental, the income, and the social network partial utility. The weights of each partial utility vary across the Sinus-Milieus® categories, reflecting different preferences of the different socioeconomic classes. These weights influence the slope of the adoption curve for each Sinus-Milieus® category [40]. When the total utility exceeds a threshold, then the agent invests in a solar PV system. The decision threshold is common across all Sinus-Milieus® categories and influences the adoption curve of the whole market segment of single- and two-family houses [40]. Each partial utility is a sigmoid function, the use of which is common in many theoretical and empirical studies including technology diffusion (for example, in [30,70,71]). A detailed discussion about the strengths and weaknesses of the S-curves is given in [72].
The financial partial utility is expressed as the discounted payback period of the investment. The detailed cash flow of the investment is calculated, by considering capital and operating expenditures, revenues from selling excess electricity to the grid, purchases of electricity to satisfy the annual consumption needs not met by the investment, capital subsidies and degradation rate of the solar PV system (based on [73]). Hence, through the detailed cash flow analysis, the financial utility captures the main economic factors driving the diffusion of the solar PV technology, such as upfront investment costs, electricity prices, optimal rates of self-consumption, access to capital, and funding, access to markets for selling excess electricity.
The environmental utility captures the influence of the environmental benefits, as these perceived by the agent, on its decision to invest. Following [40], we approximate the environmental benefits via the cumulative electricity production from the installed solar PV system over its lifetime, based on the assumption that the CO2 emissions avoided by the lifetime operation of the panel are less than the amount of CO2 emitted during the construction of the panel [3]. With this approximation, no additional assumptions regarding the future electricity mix in Switzerland are necessary, which are beyond the scope of this analysis. In [74] it has been shown that the environmental benefits can be one of the most influential factors in the decision to invest in a solar PV system, but the responsiveness of the agents in the CO2 emission savings declines as more emissions are avoided. The environmental utility is directly related to the injunctive social norm, which refers to the behavior commonly approved or disapproved of by a person’s reference group [75], i.e., investing in a solar PV technology is good for the mitigation of the climate change. In addition, because the definition of the environmental utility relates to the cumulative installations of the solar PV panels, it can also be interpreted as the level of awareness and knowledge of the potential adopter regarding the solar PV technology. In this context, the shape of the utility implies declining responsiveness of the agents as more knowledge about the solar PV technology is accumulated over time, e.g., via increased installations, marketing or advertising [76]. Hence, through the environmental utility, behavioral drivers are represented, such as the injunctive social norm and the awareness/knowledge about the technology (i.e., through campaigns).
The income partial utility is associated with the socioeconomic background of the agents. The income of an agent implicitly influences the weights of the partial utilities, and it helps in further distinguishing the agents at the Cantonal level. It also indicates the financial ability of the agent to invest in solar PV [30], and, to this end, it indirectly imposes a budgeting constraint.
Finally, the social network partial utility represents the influence of interpersonal communication on the decision to invest (i.e., it represents the descriptive social norm). Two primary communication channels are identified in the literature that induce influence from the social network: the “mass media” and the “interpersonal communication” [49]. The first channel creates product awareness (see also the environmental partial utility discussed above), but the second is considered to be more effective in persuading adopters, especially if the agents belong to the same socioeconomic background [77]. With the social network partial utility, we model the interpersonal communication as a function of the number of links that an agent has with other agents that have invested in solar PV systems. The function is normalized to guarantee that each agent has an equal response to a proportional increase in the number of links with other adopters, independently of the Sinus-Milieus® category [40].
A detailed mathematical description of the decision mechanism in the model is given in Appendix B.
2.1.3. Performing a Simulation
The model is implemented in the Java language and simulates the PV diffusion process on an annual basis from 2010 to 2050. The adopters and installed capacities of the year 2009 are given as initial conditions to be able to start the simulation. At the beginning of year N (2009<N≤2050), the income, the annual electricity consumption and the age of existing agents are updated. In addition, new agents are introduced into the system, reflecting the growth of single- and two-family houses. The structure of the social network is also updated, as existing links are broken and recreated with other agents, while new links are established with the new agents that enter into the system.
After the update of the agents and the structure of the social network, the partial utilities are calculated for every agent that is not an adopter of a solar PV system. Next, the total utility of each potential adopter is compared against the decision threshold. If the total utility exceeds the threshold, then the agent installs a PV system. Those agents that have adopted a solar PV system in year N are removed from the pool of the future potential adopters for the subsequent years. The agents that became adopters are only considered in the calculation of the social network utility. We implicitly assume that the adopters re-install the same solar PV system that they installed in the first time, whenever their investment reaches the end of its lifetime.
2.1.4. Model Calibration and Validation
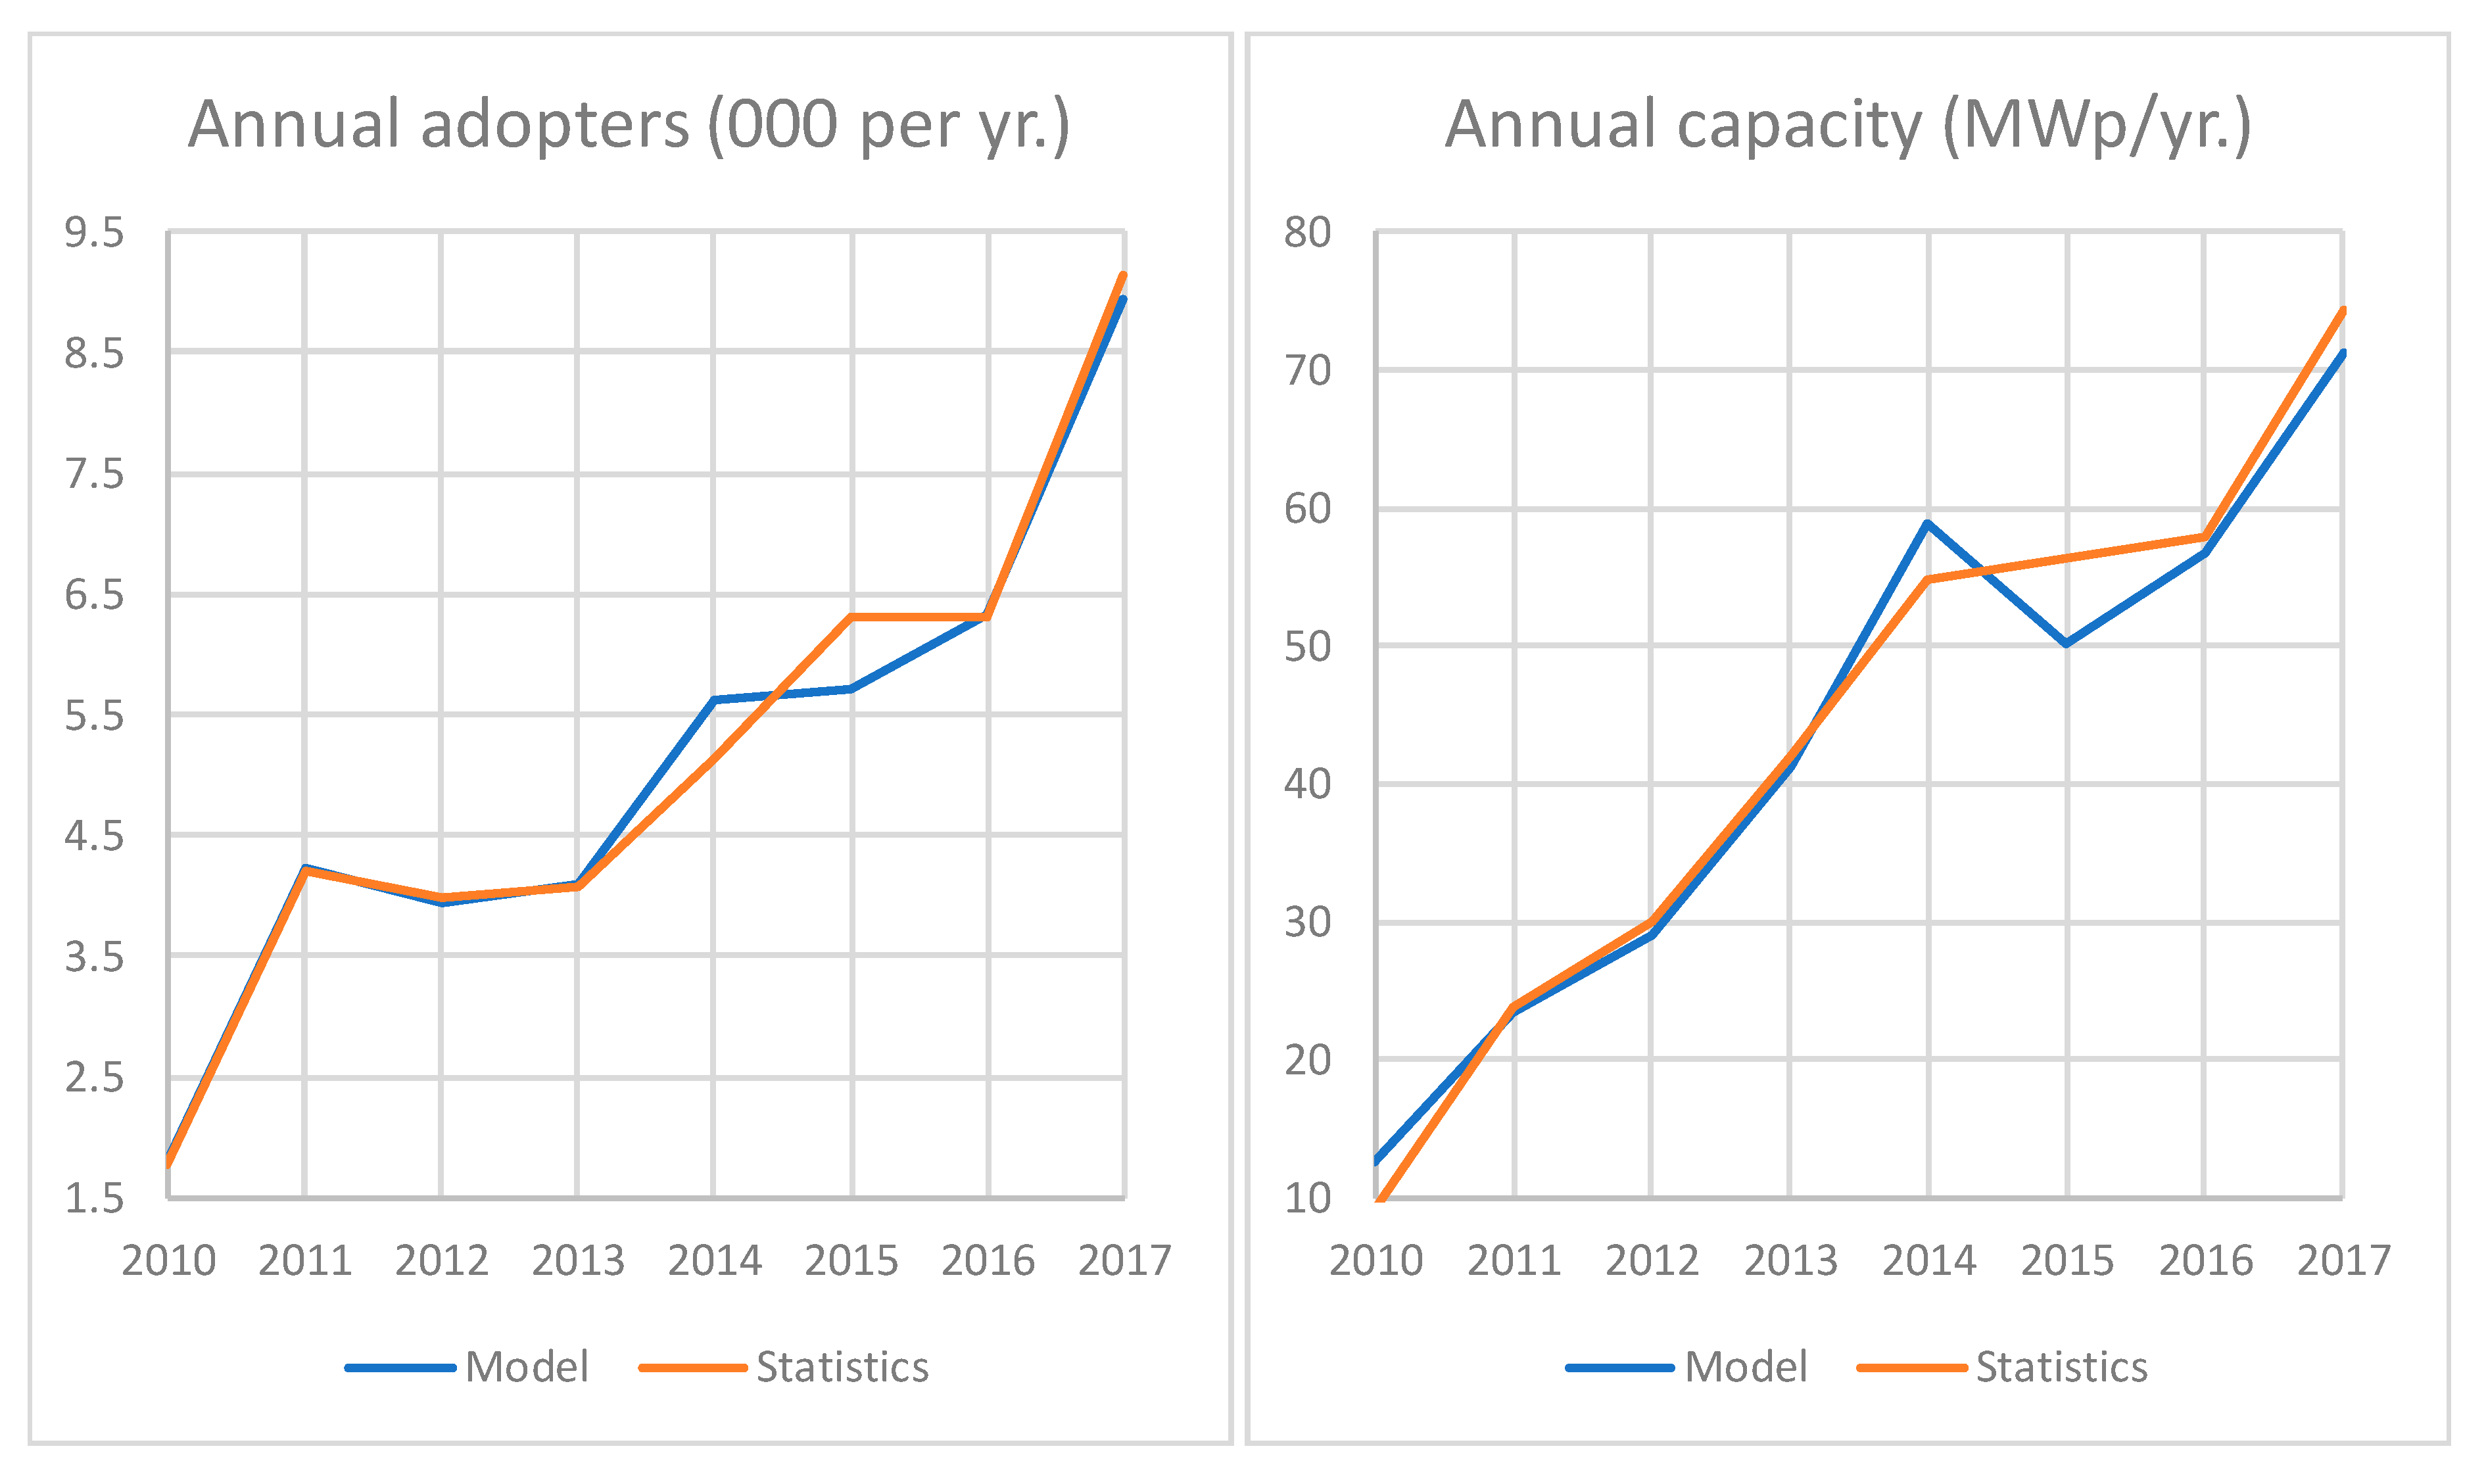
The parametrization of the model, i.e., the weights of the partial utilities, the decision threshold, and the shape of the utility functions, is based on the indirect calibration approach [78]. First, we create two sub-sets from the available dataset regarding sales and installed capacity of solar PV in single- and two-family houses in Switzerland, from 2009 to 2017 (the years before 2009 were excluded because of the low and unstable adoption rates, while the year 2009 is the initial conditions to start the simulation). The period of 2009–2014 is used as a training dataset, while the period 2015–2017 as the validation data set.
The parameters of the model are then split into two vectors. The first vector, λ, contains the partial utility weights and the decision threshold. The second vector, θ, contains the parameters corresponding to the “tipping points” of the partial utilities. We initialize k = 1..K vectors θk, with different “tipping points” for the partial utilities, in such a way that the obtained functional forms of the partial utilities are very different for every k (maximum distance of two functions). For each k we use the vector of “tipping points” θk to estimate, via maximum likelihood, a vector of weights λk that minimizes the training error regarding the rate of adoption and the cumulative installed capacity of solar PV throughout 2009–2014. Then, we choose that model k, i.e., those vectors θk and λk, which produces the minimum error in the validation data set of the period of 2015–2017. For initializing the weights of the social network utility, we based on the evidence from the Swiss literature [14], as well as studies for other countries (see also [12,13]): one solar PV panel in a neighborhood increases the installation rate by 0.8–1% three months later.
The parametrization of the model is given in Appendix B. The validation of the model against the statistics throughout 2010–2017 resulted in 0.6% error in the cumulative adopters (sales) and 1.3% error in the cumulative installed capacity.
2.2. Scenario Definitions
We apply the ABM to one core scenario and seven variants. The Reference scenario implements the policies of the Swiss energy strategy, which are in force from 1 st January 2018 [2], and the measures included in the revised CO2 Act that implements the Paris Agreement [79] (the Act is still under discussion in the Swiss parliament). Building efficiency and emission standards are not included in the Reference scenario and its variants. The inclusion of these standards would have a significant impact on the results and would dim the effect of the socioeconomic and technical drivers that are of the focus. Table 2 presents an overview of the main assumptions of the Reference scenario.
The variants of the Reference scenario are defined in Table 3. Their definition is orthogonal to evaluate the impact and role of each factor in the diffusion process separately. Unless stated otherwise, they share the same assumptions with the Reference scenario.
3. Results
3.1. Reference Scenario
The annual rate of adoption, the cumulative number of adopters and the cumulative installed capacity in the Reference scenario is presented in Figure 6. In 2050, the total installed capacity is 3083 MWp, from 369 MWp in 2017. The number of installations increases from about 44,000 in 2017 to more than 530,000 in 2050 (Figure 6b,d). However, the average installed capacity per installation declines over time: from 8 kWp in 2017 to 4.5 kWp in 2050 (Figure 6c).
There are three main reasons for the reduction in the average installed capacity in the future. The first reason is the assumed market configuration: any excess electricity that an adopter produces from the installed solar PV system can be sold at the average production cost of a nearby utility, after the phase-out of the feed-in tariff. The average cost is significantly lower than the electricity price paid by the end consumer [81]. As a result, large installations aiming at selling excess electricity are financially less attractive than smaller installations targeting the optimization of the self-consumption. The difference between the end consumer’s electricity price and the selling price of the excess electricity from solar PV broadly defines the operating strategy of the prosumer after the phase-out of the support policies (i.e., focus on self-consumption or focus on selling electricity). The second reason for the smaller, on average, installed capacity in the future is the reduction of the average annual electricity consumption of the households by 2050. The efficiency measures implemented in the Reference scenario render larger systems not cost-effective when the prosumers’ strategy focuses on self-consumption. Finally, the third reason for the reduction in the average installed capacity are budgeting constraints and shifts between consumer classes. These shifts occur as the diffusion process evolves and the pool of high-income classes (innovators, early adopters) is being depleted, while the middle-class (early majority) is starting to adopt the technology (see also Figure 7).
While in the Reference scenario, there is a deceleration in the growth of the cumulative installed solar PV capacity in single- and two-family houses in Switzerland (Figure 6d), there are no signs of saturation. The deceleration is the result of both the reduction of the average installation size and the reduction of the adoption rates after the mid of the 2030 s. As shown in Figure 6a, the rate of adoption increases until 2030, driven by the innovators (Sinus-Milieus® category 10) and the early adopters (Sinus-Milieus® categories 8 and 9). Main characteristics of the innovators are their willingness to take risks, their financial liquidity, and their high social status. Early adopters also have high social status and financial liquidity, but they are more discrete in adoption choices than the innovators. Finally, the early majority (Sinus-Milieus® categories 5 to 7) adopts innovations after a varying degree of time, which is longer than the innovators and early adopters. The behavior of the model regarding the participation of the different socioeconomic classes in the solar PV diffusion process is consistent with the literature (see for example [49]).
In 2017, innovators installed about 70% of the total solar PV systems in single- and two-family houses (model result from the calibration and validation process). By 2030, the share of adopters belonging to innovators is already 82%, and it further increases to 95% in 2050 (Figure 7). However, in 2050 the adopters belonging to innovators account for only 20% of the total adopters. This is because, after 2030, the socioeconomic classes belonging to early adopters and the early majority take the driving seat in the diffusion process, as the pool of innovators that are not adopters is being depleted. In 2050, about 94% of the agents in early adopters’ classes install a solar PV system (from only 38% in 2030). At the same time, about 50% of the agents in early majority classes become adopters (from only 12% in 2030). In total, by 2050, 40% of the total adopters are from the early adopters’ classes and another 30% from the early majority. The rest 10% is from the late majority classes. It can be expected that beyond 2050, the early majority classes will continue to drive the diffusion process of the solar PV systems, while the late majority classes will emerge by when the profitability of the investment improves further, and the social network effects increase.
Figure 8 presents the share of each partial utility in the total utility of agents that have installed a solar PV system, which is a key component of the innovation-decision mechanism of the model. In the near-term period until 2030, the decision to invest in solar PV technology is mostly influenced by the level of agent’s income and the profitability of the investment. In this regard, the financial support schemes, implemented by the government, play an important role. The environmental sensitivity and level of knowledge and awareness about the PV technology also have a significant weight in the adoption decision in the near-term period, driven by the ecological values of the innovators and early adopters.
As an increasing number of agents belonging to innovators and early adopters’ classes install a solar PV system over time, the weight of the income utility in the decision is gradually reduced. This is because lower income classes are starting to become adopters too, and the improvement in the production costs of solar PV system mitigates the barriers related to limited budgets. The weight of the environmental sensitivity lessens over time, because of the continuous decline in the average installed capacity per adopter. Following the alternative interpretation of the environmental utility as the level of awareness and knowledge about the solar PV technology, when more agents become familiar with the technology and adopt it then a point is reached beyond which the impact of the increased technology awareness and knowledge of the investment decision lessens over time. By when the lower income classes are starting to become adopters, the profitability of the investment and financial liquidity are important investment criteria. The influence from the social network is constantly increasing during the projection horizon, as an increasing number of links with adopters is established. The peer effects become of equal importance with the income in the investment decision by 2050. However, there is a slowdown in the increase of the weight of the social network in the decision to invest, due to the reduction in the adoption rate.
Figure 9 presents the geographical distribution of adopters per Swiss Canton, both as absolute values and as a share of the total population of the agents in 2050. Adoption rates of more than half of the total population of agents are achieved in the Cantons of Zürich, Neuchâtel, Vaud, and Genève. These high rates are attributable to the high average irradiation levels and high average incomes.
On the other hand, adoption rates of less than 45% occur in the Cantons of Appenzell, Uri, Glarus, Sankt Gallen, and the Cantons of Unterwalden. The lower rates in these Cantons are mostly attributable to the lower irradiation levels and, to a lesser degree, to lower average incomes. In the rest of the Cantons, about 45% to 48% of the single- and two-family houses have installed a rooftop solar PV system by 2050.
The Cantons of Zürich, Bern, Aargau account for one third of the total adopters in Switzerland in 2050 (about 11% each, on average). In contrast, the three Cantons with the highest adoption rates, Vaud, Neuchâtel, and Genève, account together for only 13% of the total adopters in 2050, since the number of single- and two-family houses in these Cantons is much lower than in Zürich, Bern, and Aargau. It can be argued that the southern Cantons benefit from higher solar irradiation levels that partly compensate for the lower number of single- and two-family houses compared to the northern Cantons. Hence, Ticino, Vaud, Wallis and Genève (i.e., south- and south-west Switzerland) have together 27% of the total adopters in 2050. Eastern Switzerland (Sankt Gallen, Thurgau, Appenzell, Glarus, Schaffhausen and Graubünden) accounts for 17% in the total number of adopters in 2050. Central Switzerland (Uri, Schwyz, Obwalden, Nidwalden, Lucerne and Zug) contributes only by 6% in the total number of adopters, mainly due to the lower solar irradiation levels compared to the other regions. The share of north-western Switzerland (Basel-Stadt, Basel-Land, and Aargau) in total adopters is 15% in 2050. The region of Espace Mittelland (Bern, Solothurn, Fribourg, Neuchâtel and Jura) contributes with another 24% in total adopters in 2050. Zürich alone accounts for the rest 12% of the adopters.
The results obtained in the Reference scenario are benchmarked against two studies regarding the future development of solar PV in Switzerland. The first study is the short-term outlook of the solar PV market in Europe from solar power [82]. The outlook for Switzerland estimates a total capacity between 2.8 GWp and 4.1 GWp by 2021. The application of today’s share of single- and two-family houses in the total market (which is about 19%) to the total capacity estimated from solar power for Switzerland results in installed capacity between 480 and 700 MWp. This figure is in-line with the estimation of 741 MWp in the Reference scenario in 2021. The second benchmarking study is the NEP scenario from the Swiss energy strategy [44], which implements the objectives of the Swiss energy and climate policy. In the NEP scenario, about 15 GWp of solar PV power are installed by the end of 2050, which implies that the share of the installed capacity in single- and two-family houses in the Reference scenario accounts for 20% of the total installed capacity projected in the NEP scenario (which is slightly higher than the today’s share of 19%).
3.2. Variants
Figure 10 presents a comparison of all variants, and with the Reference scenario, regarding the total installed solar PV capacity in single- and two-family houses in 2050. In the Weaker Policy variant, the diffusion process delays about 3 to 4 years compared to the Reference scenario. The number of adopters in the Weaker Policy in 2050 is already achieved by 2046/7 in the Reference scenario. In total, there are about 505,000 houses with a solar PV system in 2050 (−5% than in Reference). The cumulative installed capacity amounts to 2.9 GWp in the same year, also 5% less compared to the Reference scenario. It can be therefore argued that the government support schemes are necessary to stimulate a particular segment of agents from the early majority classes (which are about 25,000 single- and two-family houses), to become adopters.
In the Stronger Policy variant, the diffusion process accelerates about 4 years compared to the Reference scenario. The number of adopters is about 26,000 higher than in Reference in 2050 (or +5%) and reaches 556,000. The cumulative capacity is 3.5 GWp in 2050 or +12% from the Reference scenario, implying that the average installation size per adopter is also higher in Stronger Policy than in Reference. From the analysis of the Weaker and Stronger Policy variants, it can be concluded that about 51,000 agents from the early majority classes are sensitive to the financial incentives provided by the government. However, this number is only 10% of the total number of adopters in the Reference scenario, which implies that the diffusion of the solar PV technology in single- and two-family houses has already gained momentum.
In the High Cost variant, the diffusion process delays about 5 years compared to the Reference scenario. The total number of adopters is about 470,000 in 2050 (–11% from Reference). The cumulative installed capacity is about 2.6 GWp (–15% from Reference). Hence, the average installation size per adopter also declines, compared to Reference, due to the higher upfront investment costs. To bring the diffusion of solar PV systems to the level of the Reference scenario, increased support schemes are required in this variant.
In the Low Cost variant, the total number of adopters reaches 557,000 in 2050 (or +5% from the Reference scenario). The cumulative installed capacity is 3.4 GWp in the same year (+10% from the Reference scenario). This result also implies that the average installation size per adopter is higher in this variant than in the Reference scenario due to the favorable economics of the investment. From the analysis of both the High and Low Costs variants, it can be concluded that the financial incentives provided by the government need to be constantly adjusted for the learning rate of the technology and they constitute an administrable and tractable option to accelerate the penetration of the solar PV system.
In the High Price variant, the increase in the electricity price has a backwards-shifting impact on the adoption. The higher electricity prices act retroactively, and the diffusion process accelerates by about 5 to 6 years compared to the Reference scenario. The number of adopters is 585,000 in 2050 (+10% from the Reference scenario), and the cumulative installed capacity amounts to 3.4 GWp (+10% form the Reference scenario). Higher electricity prices enable increased rates of self-consumption, and the installed systems are mostly dimensioned to fit the household’s electricity needs, which in turn translates to a (slightly) lower average installation size per adopter compared to Reference.
In contrast, the Low Price variant displays a slowdown in the diffusion process compared to the Reference scenario. The total number of adopters is about 502,000 in 2050, and the cumulative installed capacity is 2.9 GWp. The average installation size is only slightly higher than in the Reference scenario, which can be associated with slightly lower rates of self-consumption. From the analysis of both the High and Low Prices variants, it can be concluded that the level of electricity price is an important enabler for the penetration of solar PV in single- and two-family houses, while the adopters mainly follow self-consumption strategies (i.e., naïve prosumers). However, this depends on the configuration of the market and the ability of smaller market players to participate in the electricity trading schemes.
Finally, the cost and access to capital, risk, and time preferences are important factors for the timing of the investment. In the High DRate variant, the decision to invest is postponed by almost 10 years compared to the Reference scenario. In addition, the average size of investment per adopter is smaller because higher discount rates do not favor capital-intensive projects. As a result, the total number of adopters is about 417,000 in 2050 (−22% from Reference), and the cumulative installed capacity reaches 2.3 GWp (−25% from Reference).
4. Discussion
A key pillar of the Swiss Energy Strategy is the increase of non-hydro-based renewable generation by 2050. Solar PV systems are envisaged to expand further, but currently, it is unclear if this expansion will have the same pace in all market segments. In this study, we have developed and applied an ABM to understand the dynamics of the diffusion process of the rooftop solar PV systems in the market of single- and two-family houses. We have selected this particular market segment because of three main reasons: 1) it has been quite sensitive to financial incentives provided by the government, 2) it has experienced a slowdown in its growth in the recent past, and 3) it counts for more than two thirds of the total residential building stock in Switzerland.
We apply the model in a Reference scenario, which reflects the objectives of the Swiss energy and climate policy, in-line with the implementation of the country’s commitments to the Paris Agreement. We find that in the market of single- and two-family houses the installed systems can be smaller in the future than in the past if: a) there are low rates of return from selling excess power to the grid; b) the focus of investors are on self-consumption strategies; and c) strong efficiency measures are implemented that reduce the overall electricity consumption.
We also find that by 2050, more than 50% of the modeled agents install a solar PV system, and the cumulative installed capacity increases to 3083 MW from 369 MW in 2017. Enabling factors in the decision to invest are the continuous technology learning that improves the economic performance of the investment, the higher electricity prices, the time and risk preferences of the investors, as well as peer effects from the social network and injunctive social norms.
The profitability of the investment, a major factor in the investment decision, is influenced by both the technology learning and financial incentives provided by the government. The policy support schemes need to be adjusted continuously to better reflect the economic performance of the technology on the one side and to attract investors from socioeconomic classes with limited financial liquidity on the other side. With the phase-out of the feed-in tariff and capital subsidies, other financial instruments need to be developed to overcome financial barriers from the investors. Schemes such as leasing and crowdfunding are already in place in some countries (e.g., Germany), and complement traditional financial instruments such as equity, debt financing, and energy cooperatives. Leasing is used in business models based on self-consumption (from a legislature’s perspective, when the plant operator and consumer are the same entity). In leasing, the building owner (or tenant) does not have the capital or willingness to invest in a solar PV system, and the investment is made through a utility or company. It can also be the case that the building owner invests in a solar PV system, and then the system is leased to the tenant. Crowd investing is equity-based crowdfunding where the investors become shareholders, i.e., they receive shares in return. This mechanism mainly covers the financing gap of projects, which have difficulties in getting bank credit. It is suitable for the business models considering Power Purchase Agreements and self-consumption (in fact, it is more profitable for self-consumption due to the reduced payment of the surcharge).
Innovators drive the diffusion process until 2030/5, and the diffusion curve has an inflexion point by when most of the innovators have become adopters. At this point, peer effects and the improvement in the economic performance of technology are the key enablers for attracting more agents from the other socioeconomic classes. Although interpersonal communication is an important influencing factor, it comes to saturation by when links with new adopters are being established at continuously low rates. Mass media communication and campaigns can perhaps continue attracting more agents in this case.
The rate of adoption by 2050 exceeds 90% for the agents belonging to innovators, early adopters, and early majority classes. Agents belonging to the late majority and laggards remain at very low adoption rates and do not seem to play a significant role in the Reference scenario until 2050. These socioeconomic classes are expected to drive the diffusion process after 2050, by when the pool of potential adopters from the early majority classes is depleted. The adoption rate in the early majority classes is characterized by increased volatility and uncertainty compared to the adoption rates of innovators and late majority until 2050, and it depends on the income distribution.
The cross comparison of the sensitivity analysis regarding different levels of policy support schemes, prices and technology costs shows that the diffusion process of solar PV in single- and two-family houses is starting to gain its momentum, but in the near-term is still sensitive to the profitability of the investment. To this end, the financial incentives provided by the government constitute an administrable and tractable option to accelerate the penetration of the solar PV system.
The analysis of the Reference scenario and variants also revealed some of the main drivers that can enable or constrain the prosumers’ uptake, with regards to the market segment of single- and two-family houses. These can be classified as economic drivers, behavioral drivers, technology drivers and drivers stemming from national conditions (Figure 11).
Low electricity prices and low self-consumption ratios are among the economic drivers that can limit the penetration of solar PV in single- and two-family houses and consequently, the uptake of the prosumers in this market segment. On the other hand, high electricity prices, high self-consumption ratios, and easy access to capital are considered to be favorable economic drivers for the diffusion of the solar PV systems.
Environmental awareness (i.e., the injunctive social norm), knowledge (and awareness) about the technology, and the “cool” factor (or influence from the social network—the descriptive social norm) are behavioral drivers that can accelerate prosumers. Lack of trust in technology and hassle factors (all captured via hurdle rates in our modeling framework) are identified as behavioral drivers that constraint the penetration of small-scale solar PV systems in single- and two-family houses. Viewed another way, low awareness and low knowledge of the small-scale solar PV system technology can be a major barrier in its adoption.
Technology drivers such as low cost of PV and storage, as well as low cost of electric vehicles and heat pumps (which in turn can lead to increased self-consumption ratios), can result in an increased number of prosumers. National conditions such as energy efficiency targets that reduce electricity demand (and consequently the economic benefit of installing a solar PV system) can be limiting factors for the penetration of prosumers. On the contrary, available rooftop space, the intensity of financial support measures, and building standard are national conditions that can act as enablers for accelerated prosumage. Similarly, solar irradiation level is an important national condition for the penetration of solar PV systems.
An increasing number of single- and two-family houses with a solar PV system can reduce the transmission grid investments, but they can also lead to decreased revenues for Transmission System Operators (TSOs) and increased investment in the distribution grid. While prosumers create new business opportunities, as they induce market reforms, they could also lead to increased retail electricity rates for other consumers (which are not prosumers). Prosumers can create economic, social, and environmental benefits and can increase the resilience of energy supply, but they can also reduce the taxable income and increase stranded assets. Therefore, policymakers need to keep all these in mind when considering if, when, why, and how to act. Some drivers are less clear than others are, and while economic drivers are well identified and analyzed, technology drivers can have different impacts (e.g., PV breakthroughs can accelerate prosumers’ uptake, but they can add additional cost in infrastructure).
In this context, decentralized systems with many prosumers require market reforms [83]. One example is the peer-to-peer market models, in which electricity producers and consumers bid and directly sell and buy electricity and other services (e.g., energy storage), but perhaps at high transaction costs (e.g., the distribution grid is paid a management fee plus a tariff for its distribution function). A second market model is the brokerage systems for prosumers that are connected to a micro-grid. The micro-grid can operate in connection to the main grid or autonomously in isolation. A third market model is the organized prosumer group model, in which a group of prosumers pools resources or forms a virtual power plant. However, all these models are still in the pilot phase, and a possible scale-up would require significant effort from policymakers and stakeholders. To this end, in our analysis, we followed the conventional model of selling excess electricity to the average production cost of a nearby utility. The design of the market is perhaps the most important enabling or constraining factor for scaling up prosumers.
It should be noted that the results obtained in our analysis should be interpreted with some care. There are not forecasts but what-if analyses that are assessing the factors influencing the diffusion of solar PV systems in single- and two-family houses. The Reference scenario does not implement building standards that impose minimum levels of self-sufficiency or renewable energy supply, as well as on emissions. The enforcement of such standards can have a major impact on our results, since not only they can reduce energy consumption but also, they can increase the penetration of renewable, or other low-carbon and efficient technologies.
The methodology we apply is based on several assumptions and simplifications. The parametrization of the model relies on indirect calibration using a rather small sample of years compared to the length of the projection period. However, this issue is common in many frameworks with a long-term perspective, and it is in our aims to extend both the calibration and validation periods of the model when statistical data of later years will be available. Despite these drawbacks, the model displayed a good fitting of the projections obtained with recently published statistics. This is an encouraging sign of the potential of the model.
Apart from improving the parametrization of the model, there are also additional extensions that can be considered in the framework. At first, the agents can be expanded to include multi-family houses, industrial facilities, and commercial buildings. Secondly, the spatial resolution of the model can be increased below the Cantonal level, for example, at the degree of a city or community. Third, the communication component can be expanded to include indirect communication as well. A fourth extension in the model would be the implementation of different market configurations that would help in assessing effective market designs for prosumers. Moreover, the availability of surveys evaluating the investors’ perception of the factors affecting their adoption decision would allow us to base the definition of utility functions on empirical evidence. Finally, the introduction of stochastic solar PV profiles and the option to install also a battery is also in our plans regarding the extension of the current framework.
5. Conclusions and Policy Implications
The penetration of solar PV in single- and two-family houses in Switzerland still relies on support measures determined by the design of the energy policy. The share of single- and two-family houses in the Swiss total residential building stock is about two thirds, which underpins its importance for increasing the penetration of solar PV systems in this market segment in order to meet the national climate change mitigation targets. In our analysis, in which we apply an ABM, we quantify the impact of four different socioeconomic and technical drivers on the decision to invest. In this section, we provide policy implications regarding the influence of each driver, as this influence is captured through the partial utilities of the model and their weight in the decision mechanism.
The financial partial utility encapsulates and quantifies the impact of the main economic drivers in the decision to invest in solar PV systems, such as the electricity prices, the rate of self-consumption, the upfront investment cost, as well as financing constraints related to budgeting and capital access. In our analysis, the weight of the financial utility in the investment decision increases over time, which in turn signals the necessity to remove any barriers related to these economic drivers. This implies that consumers need to be aware of their potential of reducing electricity costs, which requires consumers’ knowledge about their consumption patterns as well as suitable measuring and distribution infrastructure to be in place (e.g., smart grids provided by utilities). In addition, market impacts that result in a low electricity price have adverse effects on the consumer’s decision to install PV.
However, increasing the awareness of consumer regarding their electricity costs and saving potentials is not enough. The rate of self-consumption needs to be increased as well, to render the investment in a solar PV system financially attractive. This also implies that electricity needs to enter in new uses, e.g., in heating and mobility. To this end, building efficiency and emissions standards can achieve high electrification rates of the end-use demand. At the same time, bundling of products can be an effective marketing technique: for instance, manufactures and sellers of electric heating equipment or cars can bundle their products with solar PV and storage systems (This practice is followed by the company (https://www.solarwatt.com/components/heat-pump), or Tesla after the merge with the SolarCity (https://www.tesla.com/solarpanels?energy_redirect=true).).
On the other hand, the high upfront investment cost can be tackled via purchase agreements and leasing (This practice is followed by the company Vivint. Solar in the US (https://www.vivintsolar.com/solar-plans).) or crowdfunding. The latter is gaining momentum, facilitated by online platforms (The Mosaic platform in the US (www.joinmosaic.com)), which act as showcases of the project, and funders can access investment opportunities and financially contribute as they wish. Different types of crowdfunding can be examined, ranging from donation and reward to lending and provision of equity. Other financing models can include community-shared ownership, in which members can purchase a share of the power produced by an array of solar PV panels (e.g., installed on the roofs of series of single- and two-family houses by the construction company) and receive credits on their electricity bills.
In addition, the accessibility to a decentralized peer-to-peer market where the owner of the solar PV system can sell excess electricity is also a crucial factor in determining PV investments. In the present study, we assumed that the market is accessible for all adopters, which in reality might not be the case. Peer-to-peer market models, brokerage systems and organized prosumer group models discussed in the previous section are still in the pilot phase, and their scaling-up needs legislation to be in place. The configuration and design of the market define in a large extent the installation size, i.e., focus on self-consumption or focus on selling electricity. The latter leads to larger installations than the former.
The partial utilities referring to the environmental and social network in the model represent behavioral drivers. The social network utility is used to capture the descriptive social norms (i.e., influence from the social network), and the environmental partial utility captures the injunctive social norm, the awareness and knowledge regarding the solar PV technology. The environmental and social network partial utilities complement each other in the decision process: the results of our analysis show that while the weight of the environmental utility in the decision to invest declines over time, the weight of the social network utility increases. This result also implies that the perceived complexity of the product, often associated with the lack of knowledge about the technology, can be an important barrier regarding its diffusion. Innovative market solutions, e.g., one-stop-shops where customers can buy turnkey solar roofs (e.g., similar to the option offered by Tesla after the merging with the company SolarCity), can help in reducing the perceived complexity of the product.
The environmental sensitivity of the individuals, i.e., the perception that adopting a solar PV system is “the right thing to do” to protect the climate, also needs to be strengthened and reinforced as its weight in the decision process to adopt the technology lessens over time. The marketing of solar PV systems needs to go beyond the expectation that the product is beneficial due to aspects of climate change mitigation. Life-cycle analysis can help in exposing additional co-benefits such as life-cycle cost benefits, independence in supply, human health benefits, reduced land footprint, reduced use of materials during the manufacturing of the panels and others (see also [3]). The inclusion of life-cycle indicators in campaigns can increase not only the environmental sensitivity of the potential adopters but also it can help in better understanding the complexity, benefits and the true costs of the technology compared to other alternatives in electricity supply.
The research in psychology has long recognized that together with the injunctive social norms, the descriptive norms (i.e., imitating the behavior of the others) is an important decision factor. In our analysis, the influence of the social network gains weight in the investment decision over time. The increasing occurrence of solar PV installations in roofs and their visibility by neighbors and others directly affects intentions and strengthens the adoption of a solar PV system. In this context, government policies with the a priori assumption that investors decide on purely economic grounds, do not fully exploit the influence of the descriptive norms in the decision process. A policy basket that combines the power of peer effects with adequate financing can achieve a fast penetration of solar PV systems in targeted communities, e.g., in areas where the uniform nationwide incentives do not seem to work efficiently. This is of particular importance when solar PV systems enter in the “grid-parity” phase, and the existing financial support schemes are phased-out. For example, the state of Connecticut launched a campaign from 2013 to 2016 to increase the penetration of solar PV systems in houses. The campaign was built around the consumer’s education, consumer’s motivation, and ultimately the conversion of consumer’s interest into a decision to install a solar PV system. The result of the campaign was impressive as the houses with solar PV panels increased from 800 in 2013 to 12,500 in 2016 [84]. The outcome of this campaign demonstrated that segmentation of consumers in the policy design, targeted campaigns and improved visibility of the technology in areas with low penetration rates can help to increase the overall adoption rates of the solar PV systems in single- and two-family houses.
In addition to the socioeconomic challenges discussed above and related to financial constraints and social norms, there are also important socio-technical barriers that need to be tackled. These include, among others, product quality, complexity, durability, efficiency, and safety, as well as architectural constraints. For example, there is a large number of buildings, which offer little rooftop space for solar PV cells. Moreover, the lack of knowledge about the technology can lead to improper use and poor maintenance of the systems by the adopters. Also, poor after sales service and ineffective marketing represent socio-technical barriers preventing PV deployment. Climatic conditions, i.e., solar irradiation and precipitation, are important determinants for the profitability of PV systems and can make the solar PV panels less suitable in some areas than in others. In such areas, targeted campaigns, also focusing on broader non-financial benefits of the technology, may help in increasing the adoption rates.
In conclusion, we can argue that the diffusion of the solar PV systems in the market segment of single- and two-family houses is gaining its momentum. The reduction in the cost of producing solar PV systems helps in increasing the adoption of technology. While barriers depend on the specific individual context of consumers, various measures can facilitate the solar PV diffusion process. These include collaboration between actors (i.e., manufacturers, consumers, the building construction and the finance sector), as well as dedicated government support with policy segmentation targeting different consumer groups and focus on social norms, and effective marketing to increase product awareness and technology knowledge.
Author Contributions
conceptualization, E.P.; methodology, E.P. and S.M.; software, S.M.; validation, S.M.; formal analysis, E.P. and S.M..; writing—original draft preparation, S.M..; writing—review and editing, E.P. and S.M.; supervision, E.P.
Funding
The research reported in this paper was partially funded by the Swiss Federal Office of Energy and the Swisselectric Research through the project “System modeling for assessing the potential of decentralized biomass-CHP plants to stabilize the Swiss electricity network with increased fluctuating renewable generation (CHP-Swarm)”, and by the Swiss Competence Centre for Energy Research through the “Joint Activity: Scenario and Modeling”.
Conflicts of Interest
The authors declare no conflict of interest
Appendix A
In this Appendix, we present additional data needed for the model, as well as the probability distributions functions used to create the synthetic population of agents via Monte Carlo sampling.
The expected electricity production per Canton is assumed to be the same for all agents located at this Canton, and it is presented in Figure A1.
Figure A1.
Expected annual electricity production from 1 KWp rooftop solar PV system in each Canton in kWh/yr. (own illustration based on [45]).
Figure A1.
Expected annual electricity production from 1 KWp rooftop solar PV system in each Canton in kWh/yr. (own illustration based on [45]).

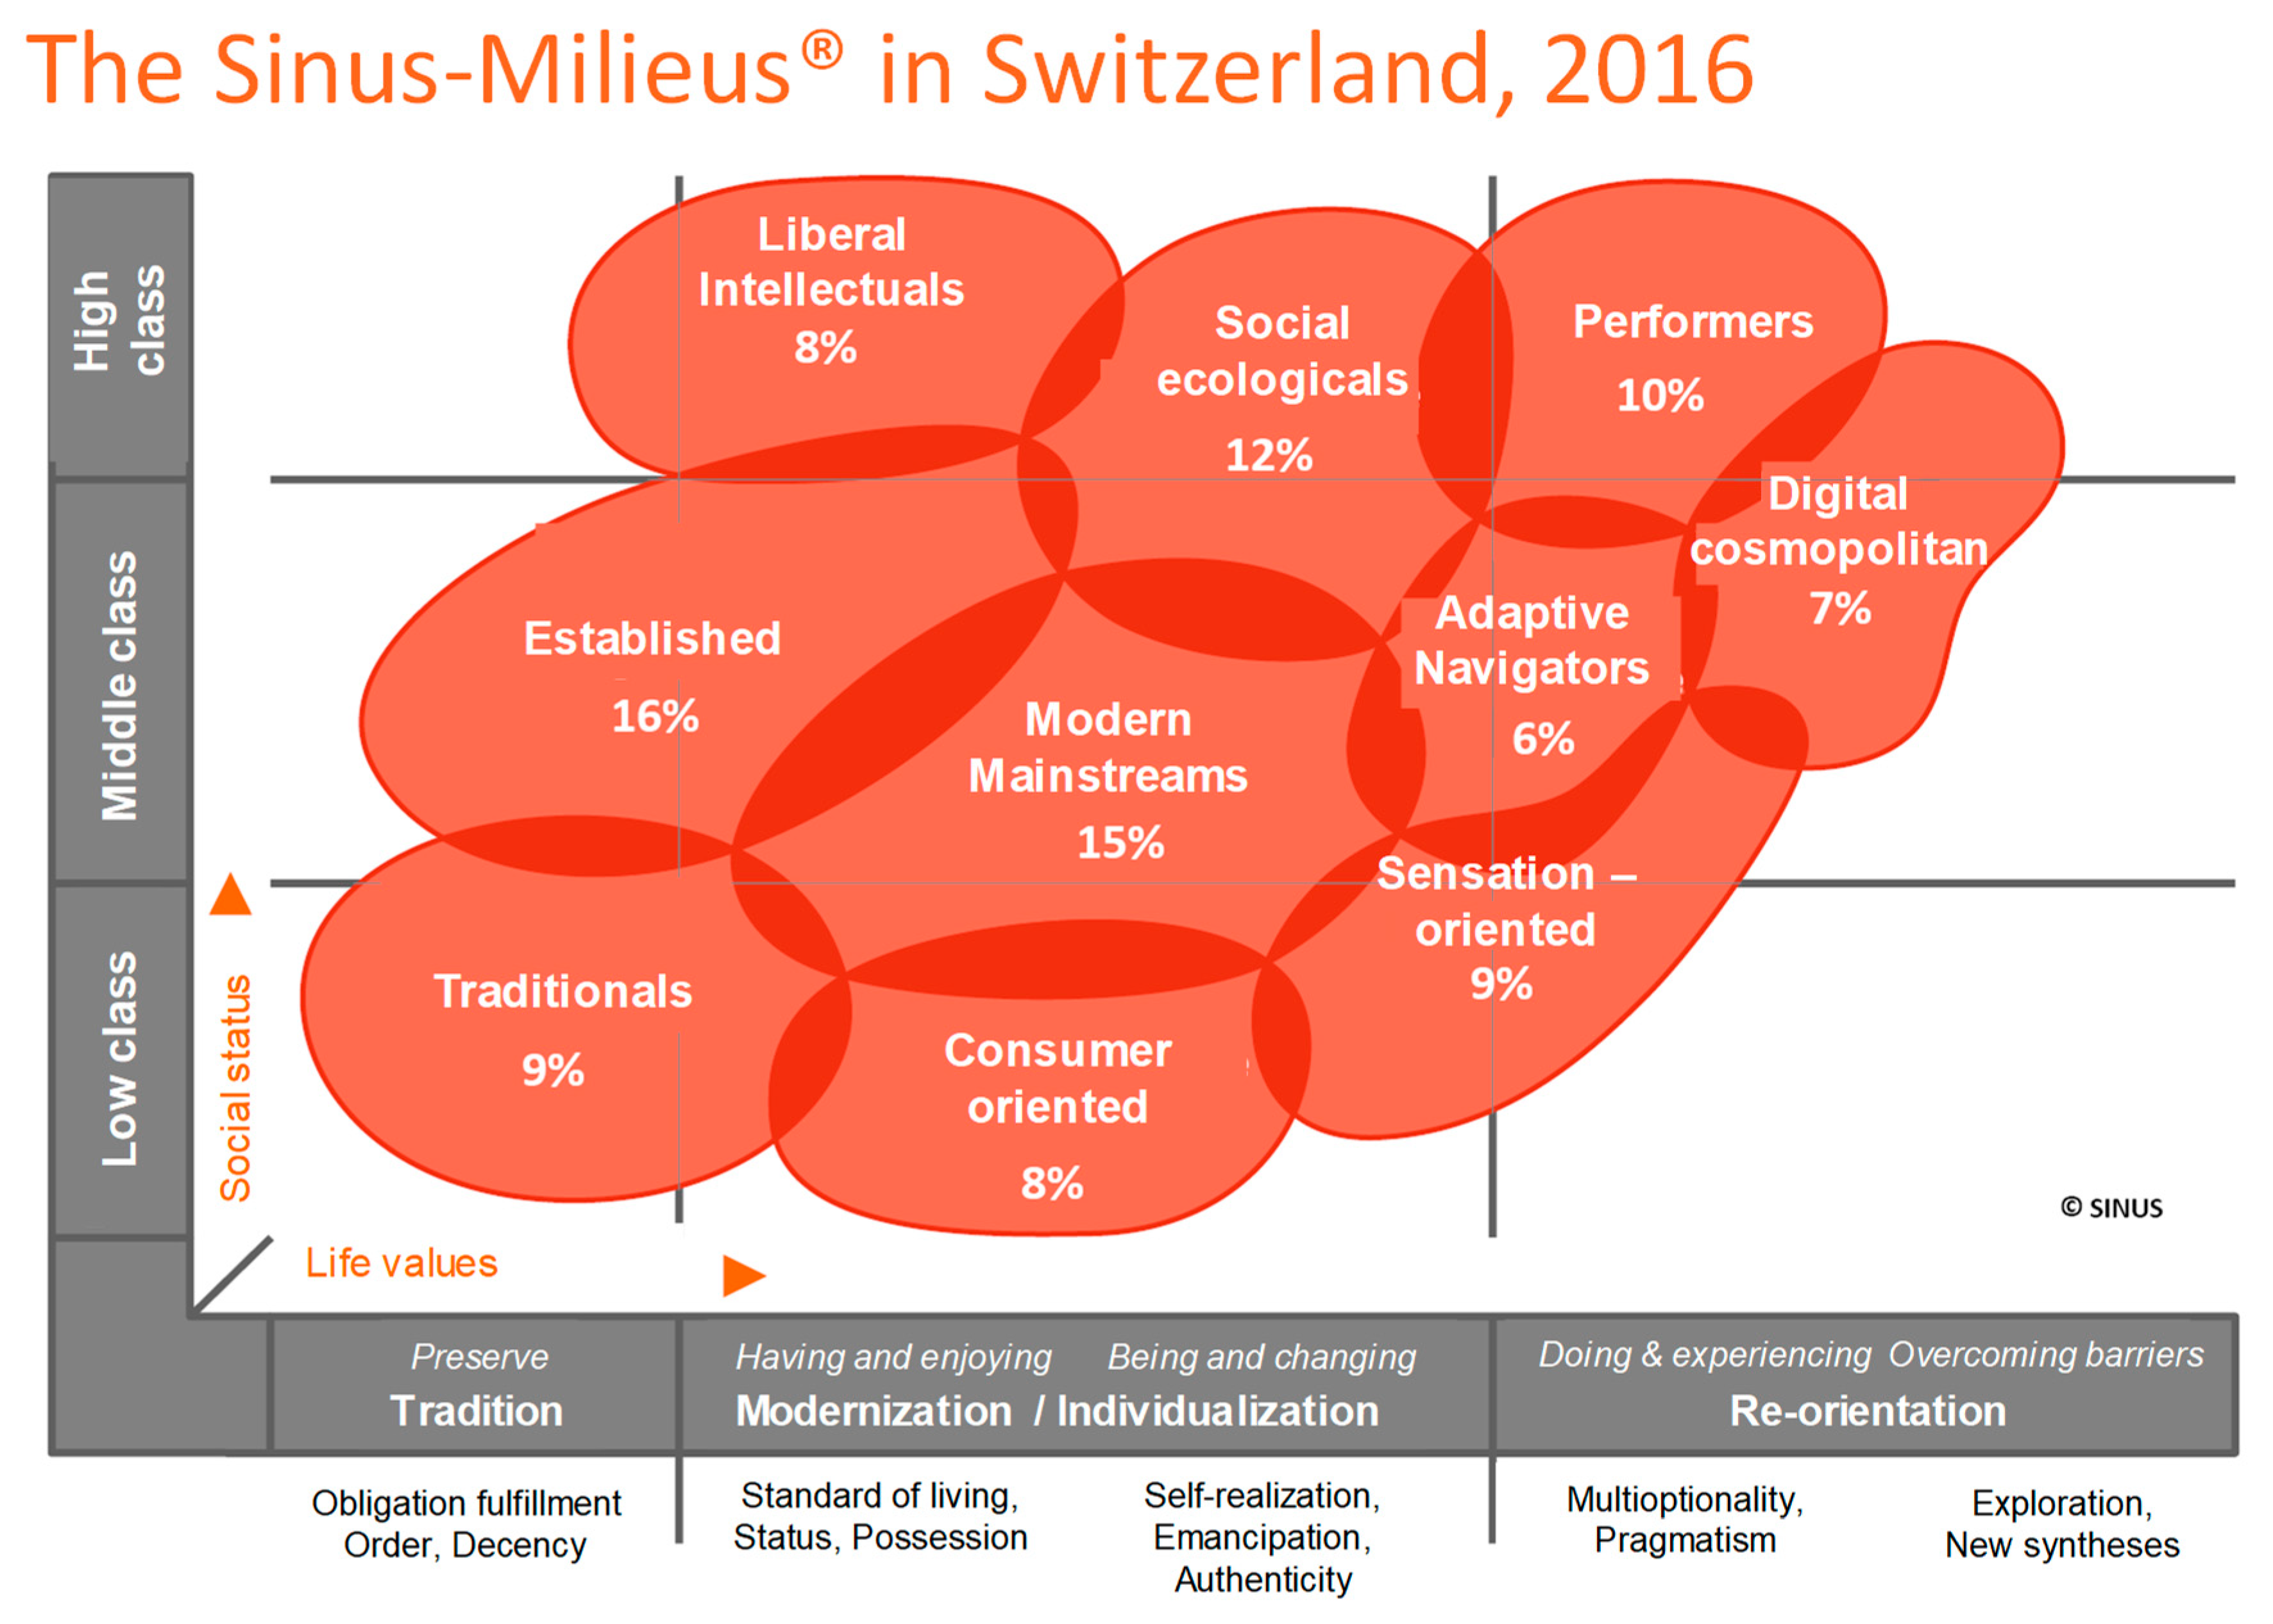
The Sinus-Milieus® that groups the population to life and ways of living and contextualize them with the socioeconomic status indicated by education, profession, and income are given in Figure A2.
Figure A2.
The Sinus-Milieus® in Switzerland for 2016. The bubbles represent the percentage of the population belonging to a particular socioeconomic group (own translation to English from the original figure in German provided by the Sinus-Milieus® Institute).
Figure A2.
The Sinus-Milieus® in Switzerland for 2016. The bubbles represent the percentage of the population belonging to a particular socioeconomic group (own translation to English from the original figure in German provided by the Sinus-Milieus® Institute).

Table A1 presents the probability of an agent to establish a link with another agent, based on the Sinus-Milieus® category. There are higher probabilities of an agent to establish links with agents from the same Sinus-Milieus® category. The probabilities are adapted from [40] based on the Sinus-Milieus® of Switzerland (Figure A2). For example, an agent of Sinus-Milieus® category 1 (Traditionals) has 65% probability of establishing a link with an agent belonging to the same category and 12% to establish a link with an agent from category 2 (Consumer-Materialists).

Table A1.
Probability of an agent to connect with another agent according to the Sinus-Milieus® category.
Table A1.
Probability of an agent to connect with another agent according to the Sinus-Milieus® category.
| Sinus ID | 1 | 2 | 3 | 4 | 5 | 6 | 7 | 8 | 9 | 10 |
|---|---|---|---|---|---|---|---|---|---|---|
| 1 | 65 | 12 | 4 | 10 | 8 | 1 | 0 | 0 | 0 | 0 |
| 2 | 12 | 60 | 8 | 5 | 14 | 0 | 0 | 0 | 1 | 0 |
| 3 | 4 | 8 | 60 | 0 | 10 | 9 | 6 | 0 | 1 | 2 |
| 4 | 10 | 5 | 0 | 55 | 12 | 3 | 0 | 8 | 6 | 1 |
| 5 | 8 | 14 | 10 | 12 | 40 | 5 | 0 | 1 | 6 | 4 |
| 6 | 1 | 0 | 9 | 3 | 5 | 40 | 15 | 13 | 8 | 6 |
| 7 | 0 | 0 | 6 | 0 | 0 | 15 | 60 | 4 | 5 | 10 |
| 8 | 0 | 0 | 0 | 8 | 1 | 13 | 4 | 50 | 16 | 8 |
| 9 | 0 | 1 | 1 | 6 | 6 | 8 | 5 | 16 | 45 | 12 |
| 10 | 0 | 0 | 2 | 1 | 4 | 6 | 10 | 8 | 12 | 57 |
The minimum number of communication links per Sinus-Milieus® category is shown Table A2. They are based on [40], and they have been adapted to the Swiss Sinus-Milieus®.
Table A2.
Minimum number of communication links per Sinus-Milieus® category.
| 1 | 2 | 3 | 4 | 5 | 6 | 7 | 8 | 9 | 10 | |
|---|---|---|---|---|---|---|---|---|---|---|
| # links | 6 | 10 | 9 | 8 | 8 | 7 | 7 | 7 | 7 | 6 |
In every year during the simulation, an agent has a probability of breaking an existing link and creating a new one with another agent. These probabilities also depend on the Sinus-Milieus® category and are given in Table A3.
Table A3.
Probability to break an existing link and create a new one.
| 1 | 2 | 3 | 4 | 5 | 6 | 7 | 8 | 9 | 10 | |
|---|---|---|---|---|---|---|---|---|---|---|
| % | 0.25 | 0.25 | 1 | 0.75 | 0.5 | 1 | 1 | 0.5 | 0.5 | 1 |
Table A4 presents the one-dimensional probability density functions used to generate multi-dimensional datasets for the synthetic population of the agents. The means of the probability distributions related to income, age, electricity consumption are shifted in the future years from their estimated values, to reflect the developments in the economic and demographic growth, as well as the efficiency measures and technology change in the climate scenario of the Swiss Energy Strategy.
Table A4.
One-dimensional probability density functions used in the model, together with their data sources and method of future adjustment.
Table A4.
One-dimensional probability density functions used in the model, together with their data sources and method of future adjustment.
| Random Variable | Probability Density Function | Future Adjustment To 2050 |
|---|---|---|
| Income | Gamma distribution is different per Canton, fitted from [67] | Its mean increases at an annual rate of 0.6%, based on the annual GDP per capita growth rate in Swiss Energy Strategy [44] |
| Age | Discrete distribution; its values are the age ranges 20–29, 30–39, 40–49, 50–65; the probability of its value reflects the population age structure in each Canton [85] | The share of ages 20–39 decreases by 0.33% p.a., while the share of ages 40–65 increases by 0.67% p.a. following the assumptions in the Swiss Energy Strategy scenarios [44,86] |
| Sinus-Milieus® category | Discrete distribution; its values correspond to the ten categories of Sinus-Milieus®; the probabilities reflect the share of the population in each category; same in all Cantons | The social structure follows the trends of the Sinus-Milieus® structural changes observed during recent decades. |
| Annual electricity consumption | Gamma distribution; fitted on data from [66]; same in all Cantons | Its mean is reduced on average by 1% p.a. based on the per capita electricity consumption in the “NEP” scenario of the Swiss Energy Strategy 1 [44] |
| Usable rooftop area | Lognormal distribution; fitted on usable rooftop area data from 160 solar PV installations [54]; different for each Canton | Remains constant over time 2; however, the area required for 1 kWp solar PV declines from 7.2 m2/kWp in 2013 to 4 m2/kWp by 2050 due to efficiency improvements [3] |
1 The NEP scenario is consistent with the near-term climate targets of the Swiss commitments in the Paris Agreement. 2 Time dynamics are implicitly introduced via the correlation of the distribution with the distribution of income.
Key quartiles of the fitted probability density functions of the random variables used for the creation of the synthetic population of agents are presented in Table A5. In Table A6, key quartiles for the probability density functions, which are common to all Cantons are presented. Finally, in Table A7, the probability of an agent to belong to a specific Sinus-Milieus® category is given.
Table A5.
Probability density functions of the random variables identifying an agent, per Canton.
| Canton | Canton Name | Annual Personal Income in Kchf (Gamma Distribution) | Age in Years Discrete Distribution Probabilities Per Age Group | |||||
|---|---|---|---|---|---|---|---|---|
| 25% | 50% | 75% | 20–29 | 30–39 | 40–49 | 50–65 | ||
| ZH | Zürich | 42.45 | 64.40 | 96.42 | 20% | 25% | 25% | 29% |
| BE | Bern | 38.62 | 55.09 | 80.41 | 20% | 21% | 25% | 34% |
| LU | Lucerne | 38.65 | 55.81 | 82.70 | 22% | 22% | 25% | 31% |
| UR | Uri | 37.45 | 53.80 | 75.77 | 21% | 20% | 25% | 34% |
| SZ | Schwyz | 40.49 | 61.36 | 100.11 | 19% | 21% | 26% | 33% |
| OW | Obwalden | 37.45 | 54.93 | 82.18 | 21% | 20% | 25% | 34% |
| NW | Nidwalden | 40.31 | 60.53 | 91.73 | 19% | 20% | 25% | 35% |
| GL | Glarus | 36.04 | 52.45 | 76.87 | 21% | 20% | 23% | 35% |
| ZG | Zug | 45.92 | 71.24 | 111.54 | 18% | 23% | 27% | 32% |
| FR | Fribourg | 38.89 | 58.02 | 85.33 | 22% | 22% | 26% | 30% |
| SO | Solothurn | 40.29 | 58.16 | 84.94 | 20% | 20% | 25% | 35% |
| BS | Basel-Stadt | 38.77 | 57.75 | 87.81 | 21% | 25% | 23% | 31% |
| BL | Basel-Landschaft | 44.95 | 66.50 | 96.36 | 19% | 20% | 26% | 35% |
| SH | Schaffhausen | 38.74 | 55.89 | 80.55 | 21% | 21% | 24% | 35% |
| AR | Appenzell Ausserrhoden | 36.85 | 54.07 | 81.40 | 20% | 19% | 25% | 36% |
| AI | Appenzell Innerrhoden | 36.85 | 54.07 | 81.40 | 23% | 20% | 24% | 32% |
| SG | St. Gallen | 37.45 | 54.27 | 79.35 | 23% | 21% | 24% | 32% |
| GR | Graubünden | 38.08 | 55.78 | 82.94 | 21% | 20% | 25% | 34% |
| AG | Aargau | 41.68 | 61.88 | 90.00 | 20% | 22% | 25% | 33% |
| TG | Thurgau | 38.13 | 56.60 | 83.94 | 21% | 20% | 25% | 33% |
| TI | Ticino | 34.99 | 53.04 | 81.02 | 18% | 21% | 28% | 34% |
| VD | Vaud | 40.52 | 62.45 | 96.58 | 22% | 23% | 25% | 30% |
| VS | Valais | 35.93 | 54.13 | 79.77 | 22% | 21% | 25% | 33% |
| NE | Neuchâtel | 37.45 | 56.58 | 84.24 | 21% | 22% | 26% | 31% |
| GE | Geneva | 41.40 | 66.36 | 100.12 | 21% | 25% | 25% | 29% |
| JU | Jura | 34.26 | 50.90 | 75.89 | 21% | 19% | 25% | 35% |
Table A6.
Probability density functions of the random variables identifying an agent, common to all Cantons.
Table A6.
Probability density functions of the random variables identifying an agent, common to all Cantons.
| Annual Electricity Consumption kWh (Gamma Distribution Quartiles) | Usable Rooftop Area (Lognormal Distribution Quartiles) | ||||
|---|---|---|---|---|---|
| 25% | 50% | 75% | 25% | 50% | 75% |
| 4081 | 5200 | 6652 | 18.86 | 24.00 | 33.33 |
Table A7.
Probability to belong to a Sinus-Milieus® category.
| Discrete Distribution Probabilities per Sinus-Milieus® Category | |||||||||
|---|---|---|---|---|---|---|---|---|---|
| 1 | 2 | 3 | 4 | 5 | 6 | 7 | 8 | 9 | 10 |
| 9 | 8 | 9 | 16 | 15 | 6 | 7 | 8 | 12 | 10 |
Figure A3 presents an overview of the procedure followed to establish a synthetic population of single- and two-family houses in Switzerland. To create the synthetic population, first, the number of agents in each Canton is determined. Then for each agent in each Canton, the expected annual electricity production from 1 kWp solar PV is calculated and assigned. Monte Carlo sampling is employed next based on the joint PDFs of the random variables to complete the initialization of the attributes of each agent. The sampling considers correlations between income and age (89%), income and Sinus-Milieus® category (88%), income and rooftop area (85%), income and annual electricity consumption (60%).
Figure A3.
Overview of the process of creating a synthetic population of agents.

Appendix B
In this Appendix, we give the mathematical formulation of the decision mechanism of the model, together with the parametrization of the partial utility functions, the calibration of the model and its validation. Table A8, Table A9 and Table A10 present the nomenclature of the model.
Table A8.
Indices used in the mathematical description of the model.
| Index | Description |
|---|---|
| Periods () | |
| Agent ( | |
| Partial utility (f = financial, e = environmental, i = income, s = social network) | |
| PV capacities available kW | |
| Canton, | |
| Sinus-Milieus® category | |
| Support policy, capital subsidy or feed-in tariff ( |
Table A9.
Parameters used in the mathematical description of the model.
| Parameter | Description |
|---|---|
| Entry year of agent in the simulation (1 = agent enters in year ) | |
| Existence of agent in year (1 = agent exists in year ) | |
| Existence of agent in Canton (1 = agent is located in Canton ) | |
| Participation of agent in Sinus-Milieus® category (1 = agent belongs in Sinus-Milieus® ) | |
| Economic lifetime of solar PV system (years) | |
| Square meters needed for installing the solar PV system in year (sqm) | |
| Capacity of solar PV system | |
| Investment cost of the solar PV system in year (CHF) | |
| Fixed O&M cost of the solar PV system in year (CHF/yr.) | |
| Degradation rate of solar PV system at the end of the first year of its operation (%) | |
| Annual degradation rate of the solar PV system after the first year of its operation (%) | |
| Number of years that the feed-in tariff is received if investing in a solar PV system in year | |
| Level of policy support type received by the solar PV system if installed in year (CHF if , CHF/kWh if ) | |
| Calibration weights for the partial utility of Sinus-Milieus® category in year | |
| Shape parameter of the partial utility in year | |
| Tipping-point parameter of the partial utility in year | |
| Decision threshold per sinus category | |
| Income of agent in year (kCHF) | |
| Grid connection costs of agent in year (CHF/kWp) | |
| Annual electricity consumption of agent in year (CHF/kWh) | |
| Production cost of electricity in the location of agent and year (CHF/kWh) | |
| Electricity price paid by agent in year (CHF/kWh) | |
| Discount rate of agent (%) | |
| Expected annual electricity production of agent from 1 kWp solar PV system (kWh) | |
| Usable rooftop area of agent for installing a solar PV system (sqm) |
Table A10.
Endogenous variables used in the mathematical description of the model.
| Variable | Description |
|---|---|
| Agents that have installed a solar PV system in year t (1 = agent h installs solar PV in year ) | |
| Communication link between agents and in year (1 = link exists) | |
| Total links of agent in year | |
| Maximum links that an agent can have with other agents | |
| Number of communication links of with agents installed a solar PV system in year | |
| Support policy chosen by agent (1 = agent chooses support policy ) | |
| Total utility of agent in year [0,1] | |
| Partial utility of agent in year [0,1] | |
| Installed capacity of solar PV system adopted by agent (kWp) | |
| Investment expenditure of agent in year (CHF) | |
| Net Present Value of the cash flow of agent in period for support policy (CHF) | |
| Best net present value of the cash flow of agent in period (CHF) | |
| Discounted payback period of agent in year | |
| Electricity production from the installed solar PV system of agent in year (kWh) | |
| Share of electricity from solar PV which is consumed on-site (%) |
The pseudo-algorithm regarding the decision to adopt a solar PV system in a time-step in the simulation is given next:
| Decision algorithm: For each year : For each agent with and : call: Break existing links and create new ones with probability For each such that : s.t Next , , , Next Next |
The parametrization of the model regarding the shape and tipping-point parameters of the partial utility functions is presented in Table A11. The shape of the partial utility functions is presented in Figure A4.
Table A11.
Parametrization of the S-shape partial utility functions.
| Partial Utility | Shape Parameter μ | Tipping Point Parameter β | Comment |
|---|---|---|---|
| Financial | 2.7 | 13 | The parameter corresponds to the middle of the lifetime of solar PV systems |
| Environmental | 50 | 650 | The parameter equals to the 1/13 of the lifetime electricity production of a 7 kWp reference system; the parameter equals to the lifetime production of a 7 kWp reference system |
| Income | 10000 | Calculated during the simulation | The parameter is calculated in each simulation step as the average income of all agents existing in year |
| Social Network | 2.8 | 0.5 | The parameter implies that the tipping point of 50% is reached when half of the links of the agent is with adopters |
Figure A4.
The four partial utilities influencing the investment decision of an agent.

The weights of the partial utilities resulted from the calibration process are given in Table A12. The decision threshold is set to 0.532 for all Sinus-Milieus® categories.
Table A12.
Calibrated weights of each partial utility and decision threshold per Sinus-Milieus® category.
Table A12.
Calibrated weights of each partial utility and decision threshold per Sinus-Milieus® category.
| Sinus-Milieus® Category | Weight Financial Utility | Weight Environmental Utility | Weight Income Utility | Weight Social Network Utility |
|---|---|---|---|---|
| 1 | 0.2576 | 0.2633 | 0.1924 | 0.2868 |
| 2 | 0.2319 | 0.2705 | 0.2180 | 0.2796 |
| 3 | 0.2422 | 0.2656 | 0.2218 | 0.2704 |
| 4 | 0.2642 | 0.2762 | 0.1929 | 0.2667 |
| 5 | 0.2520 | 0.2699 | 0.2045 | 0.2735 |
| 6 | 0.2515 | 0.2711 | 0.2085 | 0.2689 |
| 7 | 0.2537 | 0.2720 | 0.2053 | 0.2690 |
| 8 | 0.1750 | 0.2492 | 0.2326 | 0.3433 |
| 9 | 0.1737 | 0.2477 | 0.2337 | 0.3449 |
| 10 | 0.1746 | 0.2460 | 0.2304 | 0.3490 |
The model was validated against the statistics regarding solar PV sales and installed capacity in single- and two-family houses in Switzerland. Figure A5 presents the comparison of the model results with the actual statistics throughout 2010–2017. The year 2009 is the base year of the model and represents the initial conditions to start the simulation. This implies that the adopters of the year of 2009 together with the installed capacities are exogenously given to the model to be able to calculate the adopters and installed capacities of 2010 (the first year by when the actual simulation starts). The model results underestimate by 0.6% the number of cumulative adopters and by 1.3% the cumulative installed capacity in 2017. The good fitting of the model is mainly due to the high degrees of freedom, resulted from the large sample, and it is not an outcome of extensive overfitting to the actual data.
Figure A5.
Comparison of the model results and actual statistics during the calibration and validation period of 2010–2017, regarding annual adopters (left) and annual installed capacity (right); the year of 2009 is not shown here, because it represents the initial conditions to start the simulation (i.e., both the adopters and the installed capacities are exogenously given to the model).

The results from Figure A5 also imply that there is a sensitivity of the model to profound changes in the policy scheme (which also observed in reality). In an attempt to quantify this sensitivity, we apply orthogonal shocks to the policy intensity, and then we estimate the short-term elasticity of the decision mechanism. The estimation is based on the response of the financial utility to the policy intensity. By applying a large range of shocks, we estimate an elasticity of the response of the financial utility of about 1.204901, as presented in Figure A6. This implies that the sensitivity of the financial utility to the policy intensity is about 20%, which is the difference of the estimated elasticity from the value of 1 (i.e., from the “perfect” response”). Given that the average weight of the financial utility to the decision mechanism across all Sinus-Milieus® categories is about 0.23 (see also Table A12), it turns out that the short-term sensitivity of the decision mechanism to intense policy changes is about 5%.
Additionally, there is a long-term sensitivity of the decision mechanism to profound policy changes, which is indirectly induced through the environmental and the social network utilities. However, the long-term sensitivity is hard to be quantified. A rough approximation can be made by comparing the number of adopters between the Weaker Policy and the Stronger Policy variants. The long-term difference of these two variants is about 10% over a period of approximately 30 years, of which 2% is due to the short-term sensitivity. Hence, the rest 8% can be considered to be attributable to the long-term sensitivity. Thus, on an annual basis, the long-term sensitivity of the model is about 0.27% p.a.
Figure A6.
Estimated elasticity of the financial partial utility to the policy intensity. The table on the left (a) presents the estimated output, while the figure on the right (b) presents the actual, fitted, and residual plots. A tipping point is visible, in which an abrupt change in the financial utility takes place when the policy intensity exceeds a threshold (the threshold depends on the investment costs and electricity prices).

References
- UNFCCC. Adoption of the Paris Agreement. Proposal by the President; United Nations Office: Geneva, Switzerland, 2015.
- BFE. Energy Strategy 2050 after the Popular Vote; BFE: Bern, Switzerland, 2017.
- Bauer, C.; Hirschberg, S.; Bäuerle, Y.; Biollaz, S.; Calbry-Muzyka, A.; Cox, B.; Heck, T. Potentials, Costs and Environmental Assessment of Electricity Generation Technologies; Bauer, C., Hirschberg, S., Eds.; PSI, WSL, ETHZ, EPFL; Paul Scherrer Institut: Villigen, Switzerland, 2017. [Google Scholar]
- BFE Energiegesetz. Available online: https://www.admin.ch/opc/de/classified-compilation/20121295/index.html (accessed on 20 June 2019).
- RES LEGAL Renewable Energy Policy Database and Support. Available online: http://www.res-legal.eu/home/ (accessed on 19 April 2019).
- Hostettler, T.; (BFE) B. für E. Markterhebung Sonnenenergie—Teilstatistik der Schweizerischen Statistik der Erneuerbaren Energien; Bundesamt für Energie (BFE) and Swissolar: Zurich, Switzerland, 2017.
- EurObserv’ER. Photovoltaic Barometer; EurObserv’ER: Paris, France, 2012; Volume 7. [Google Scholar]
- (BFS) B. für S. Gebäude-und Wohnungsregister. Available online: https://www.bfs.admin.ch/bfs/de/home/register/gebaeude-wohnungsregister.html (accessed on 20 June 2019).
- Panos, E.; Kannan, R. Challenges and Opportunities for the Swiss Energy System in Meeting Stringent Climate Mitigation Targets. In Limiting Global Warming to Well Below 2 °C: Energy System Modelling and Policy Development; Giannakidis, G., Karlsson, K., Labriet, M., Gallachóir, B.Ó., Eds.; Springer: Berlin, Germany, 2018; pp. 155–172. [Google Scholar]
- Karneyeva, Y.; Wüstenhagen, R. Solar feed-in tariffs in a post-grid parity world: The role of risk, investor diversity and business models. Energy Policy 2017, 106, 445–456. [Google Scholar] [CrossRef]
- Steinbach, J.; Staniaszek, D. Discount Rates in Energy System Analysis; Fraunhofer ISI, Building Performance Institute Europe (BPIE): Karlsruhe, Germany, 2015. [Google Scholar]
- Richter, L. Social Effects in the Diffusion of Solar Photovoltaic Technology in the UK; Energy Policy Research Group: Cambridge, UK, 2013. [Google Scholar]
- Bollinger, B.; Gillingham, K. Peer Effects in the Diffusion of Solar Photovoltaic Panels. Mark. Sci. 2012, 31, 900–912. [Google Scholar] [CrossRef]
- Petrovich, B.; Hille, S.L.; Wüstenhagen, R. Beauty and the budget: homeowners’ motives for adopting solar panels in a post-grid parity world. In Proceedings of the 6 th World Congress of Environmental and Resource Economists (WCERE), St.Gallen, Switzerland, 25–29 June 2018. [Google Scholar]
- Curtius, H.C. Diffusion of Solar Photovoltaics: Consumer Preferences, Peer Effects and Implications for Clean Energy Marketing. Ph.D. Thesis, The University of St. Gallen, St. Gallen, Switzerland, 2018. [Google Scholar]
- Rai, V.; Reeves, D.C.; Margolis, R. Overcoming barriers and uncertainties in the adoption of residential solar PV. Renew. Energy 2016, 89, 498–505. [Google Scholar] [CrossRef]
- Karjalainen, S.; Ahvenniemi, H. Pleasure is the profit—The adoption of solar PV systems by households in Finland. Renew. Energy 2019, 133, 44–52. [Google Scholar] [CrossRef]
- Curtius, H.C.; Hille, S.L.; Berger, C.; Hahnel, U.J.J.; Wüstenhagen, R. Shotgun or snowball approach? Accelerating the difussion of rooftop solar photovoltaics through peer effects and social norms. Energy Policy 2018, 118, 596–602. [Google Scholar] [CrossRef]
- Kiesling, E.; Günther, M.; Stummer, C.; Wakolbinger, L.M. Agent-based simulation of innovation diffusion: A review. Cent. Eur. J. Oper. Res. 2012, 20, 183–230. [Google Scholar] [CrossRef]
- Faber, A.; Valente, M.; Janssen, P. Exploring domestic micro-cogeneration in the Netherlands: An agent-based demand model for technology diffusion. Energy Policy 2010, 38, 2763–2775. [Google Scholar] [CrossRef]
- Eppstein, M.J.; Grover, D.K.; Marshall, J.S.; Rizzo, D.M. An agent-based model to study market penetration of plug-in hybrid electric vehicles. Energy Policy 2011, 39, 3789–3802. [Google Scholar] [CrossRef]
- Zhuge, C.; Wei, B.; Dong, C.; Shao, C.; Shan, Y. Exploring the future electric vehicle market and its impacts with an agent-based spatial integrated framework: A case study of Beijing, China. J. Clean. Prod. 2019, 221, 710–737. [Google Scholar] [CrossRef] [Green Version]
- Snape, J.R.; Boait, P.J.; Rylatt, R.M. Will domestic consumers take up the renewable heat incentive? An analysis of the barriers to heat pump adoption using agent-based modelling. Energy Policy 2015, 85, 32–38. [Google Scholar] [CrossRef] [Green Version]
- Hesselink, L.X.W.; Chappin, E.J.L. Adoption of energy efficient technologies by households-Barriers, policies and agent-based modelling studies. Renew. Sustain. Energy Rev. 2019, 99, 29–41. [Google Scholar] [CrossRef]
- Lee, T.; Yao, R.; Coker, P. An analysis of UK policies for domestic energy reduction using an agent based tool. Energy Policy 2014, 66, 267–279. [Google Scholar] [CrossRef] [Green Version]
- Zhang, T.; Nuttall, W.J. Evaluating Government’s Policies on Promoting Smart Metering Diffusion in Retail Electricity Markets via Agent-Based Simulation. J. Prod. Innov. Manag. 2011, 28, 169–186. [Google Scholar] [CrossRef]
- McCoy, D.; Lyons, S. Consumer preferences and the influence of networks in electric vehicle diffusion: An agent-based microsimulation in Ireland. Energy Res. Soc. Sci. 2014, 3, 89–101. [Google Scholar] [CrossRef]
- Noori, M.; Tatari, O. Development of an agent-based model for regional market penetration projections of electric vehicles in the United States. Energy 2016, 96, 215–230. [Google Scholar] [CrossRef]
- Wolf, I.; Schröder, T.; Neumann, J.; de Haan, G. Changing minds about electric cars: An empirically grounded agent-based modeling approach. Technol. Forecast. Soc. Chang. 2015, 94, 269–285. [Google Scholar] [CrossRef] [Green Version]
- Zhao, J.; Mazhari, E.; Celik, N.; Son, Y.-J. Hybrid agent-based simulation for policy evaluation of solar power generation systems. Simul. Model. Pract. Theory 2011, 19, 2189–2205. [Google Scholar] [CrossRef]
- Rai, V.; Robinson, S.A. Agent-based modeling of energy technology adoption: Empirical integration of social, behavioral, economic, and environmental factors. Environ. Model. Softw. 2015, 70, 163–177. [Google Scholar] [CrossRef] [Green Version]
- Ajzen, I. The theory of planned behavior. Organ. Behav. Hum. Decis. Process. 1991, 50, 179–211. [Google Scholar] [CrossRef]
- Zhang, H.; Vorobeychik, Y.; Letchford, J.; Lakkaraju, K. Data-driven agent-based modeling, with application to rooftop solar adoption. Auton. Agents Multi-Agent Syst. 2016, 30, 1023–1049. [Google Scholar] [CrossRef]
- Davidson, C.; Drury, E.; Lopez, A.; Elmore, R.; Margolis, R. Modeling photovoltaic diffusion: An analysis of geospatial datasets. Environ. Res. Lett. 2014, 9, 74009. [Google Scholar] [CrossRef]
- Robinson, S.A.; Stringer, M.; Rai, V.; Tondon, A. GIS-Integrated Agent-Based Model of Residential Solar PV Diffusion. In Proceedings of the 32 nd USAEE/IAEE North American Conference, Anchorage, AK, USA, 28–31 July 2013; pp. 1–19. [Google Scholar]
- Zhang, H.; Vorobeychik, Y.; Letchford, J.; Lakkaraju, K. Predicting Rooftop Solar Adoption Using Agent-Based Modeling. In Proceedings of the AAAI Fall Symposium, Arlington, VA, USA, 13–15 November 2014; pp. 44–51. [Google Scholar]
- Macal, C.M.; Graziano, D.J.; Ozik, J. Modeling Solar PV Adoption: A Social-Behavioral Agent-Based Framework. In Proceedings of the 2014 AAAI Fall Symposium Series, Arlington, VA, USA, 28–31 July 2013; pp. 24–31. [Google Scholar]
- Lee, M.; Hong, T. Hybrid agent-based modeling of rooftop solar photovoltaic adoption by integrating the geographic information system and data mining technique. Energy Convers. Manag. 2019, 183, 266–279. [Google Scholar] [CrossRef]
- Alyousef, A.; Adepetu, A.; de Meer, H. Analysis and model-based predictions of solar PV and battery adoption in Germany: An agent-based approach. Comput. Sci. Res. Dev. 2017, 32, 211–223. [Google Scholar] [CrossRef]
- Palmer, J.; Sorda, G.; Madlener, R. Modeling the diffusion of residential photovoltaic systems in Italy: An agent-based simulation. Technol. Forecast. Soc. Chang. 2015, 99, 106–131. [Google Scholar] [CrossRef]
- Borghesi, A.; Milano, M. Merging Observed and Self-Reported Behaviour in Agent-Based Simulation: A Case Study on Photovoltaic Adoption. Appl. Sci. 2019, 9, 2098. [Google Scholar] [CrossRef]
- Adepetu, A.; Alyousef, A.; Keshav, S.; de Meer, H. Comparing solar photovoltaic and battery adoption in Ontario and Germany: An agent-based approach. Energy Inform. 2018, 1. [Google Scholar] [CrossRef]
- Sinitskaya, E.; Gomez, K.J.; Bao, Q.; Yang, M.C.; MacDonald, E.F. Examining the Influence of Solar Panel Installers on Design Innovation and Market Penetration. J. Mech. Des. 2019, 141, 41702–41714. [Google Scholar] [CrossRef]
- Prognos. Die Energieperspektiven für die Schweiz bis 2050 Energienachfrage und Elektirzitätsangebot in der Schweiz 2000–2050 Ergebnisse der Modellrechnungen für das Energiesystem; Prognos: New York, NY, USA, 2012. [Google Scholar]
- JRC PV. Potential Estimation Utility. Available online: http://re.jrc.ec.europa.eu/pvgis/apps4/pvest.php (accessed on 20 June 2019).
- Schwarz, N.; Ernst, A. Agent-based modeling of the diffusion of environmental innovations—An empirical approach. Technol. Forecast. Soc. Chang. 2009, 76, 497–511. [Google Scholar] [CrossRef]
- SINUS; GmbH S.M. und S. Information on Sinus-Milieus®; SINUS Markt-und Sozialforschung GmbH: Heidelberg, Germany, 2015. [Google Scholar]
- SINUS Die Sinus-Milieus® in der Schweiz in 2013. Available online: https://www.ggg-migration.ch/tagung-2014.html?file=files/GGG-MIGRATION/02_Information/fachtagung/2014/SINUS-Milieus%202013%20-%20 Kurzuebersicht.pdf (accessed on 20 June 2019).
- Rogers, E. The Diffusion of Innovations, 5th ed.; The Free Press: New York, NY, USA, 2003; ISBN 978-0743222099. [Google Scholar]
- SINUS Die Sinus-Milieus® in der Schweiz. Available online: http://www.kath-tg.ch/tl_files/kath-tg.ch/fachstellen/kirchliche-erwachsenenbildung/Glaubenskurs/Allgemein/Sinus-Milieu Schweiz-Einfuehrung Kaeser.pdf (accessed on 20 June 2019).
- SINUS Die Sinus-Milieus® in der Schweiz in 2016. Available online: https://www.sinus-institut.de/sinus-loesungen/sinus-milieus-schweiz/ (accessed on 20 June 2019).
- Swiss Statistics on Population, National Ecomony, Prices, Energy, Sustainable Development and Transport 2017. Available online: https://www.bfs.admin.ch/bfs/en/home.html (accessed on 20 June 2019).
- ElCom Site Internet de l’Elcom Concernant les Prix de l’électricité: Comparez le Prix de Votre Courant. Available online: https://www.strompreis.elcom.admin.ch (accessed on 20 June 2019).
- Solstis Installations de Référence. Available online: http://www.solstis.ch/en/references/installations-reference?cck=installations_de_reference&type_dinstallation=14&systme_de_montage=L%27 apposé / sur tuiles&pays=Suisse&boxchecked=0&search=liste_des_installations&task=search&start=150 (accessed on 20 June 2019).
- FORS. FORSbase Online Data Portal for Social Science Studies and Data in Switzerland; FORS: Lausanne, Switzerland, 2016. [Google Scholar]
- Rubinstein, R.Y.; Kroesse, D.P. Simulation and the Monte Carlo Method, 2nd ed.; Wiley: Hoboken, NJ, USA, 2004; ISBN 978-0-470-17794-5. [Google Scholar]
- Beckman, R.J.; Baggerly, K.A.; McKay, M.D. Creating synthetic baseline populations. Transp. Res. Part A Policy Pract. 1996, 30, 415–429. [Google Scholar] [CrossRef]
- Guo, J.Y.; Bhat, C.R. Population synthesis for microsimulating travel behavior. In Activity and Time Use Analysis; Transp. Res. Rec. 2007, 2014, 92–101. [Google Scholar] [CrossRef]
- Müller, K.; Axhausen, W.K. Hierarchical IPF: Generating a Synthetic Population for Switzerland; IVT–ETH: Zürich, Switzerland, 2011. [Google Scholar]
- Horni, A.; Nagel, K.; Axhausen, K.W. The Multi-Agent Transport Simulation MATSim; London Ubiquity Press: London, UK, 2016. [Google Scholar]
- Nakamya, J.; Moons, E.; Wets, G. How Real Are Synthetic Populations? In Proceedings of the 57th Session of the International Statistical Institute (ISI), Durban, South Africa, 16–22 August 2009; pp. 1–5. [Google Scholar]
- Wilson, A.G.; Pownall, C.E. A New Representation of the Urban System for Modelling and for the Study of Micro-Level Interdependence. Area 1976, 8, 246–254. [Google Scholar]
- BFS Gross Monthly Wage by Age—Private and Public (Confederation) Sectors-Switzerland. Available online: https://www.bfs.admin.ch/bfs/en/home/statistics/catalogues-databases/tables.html?dyn_publishingyearend=2019&dyn_title=Gross%20 Monthly%20 Wage%20 by%20 Age%20 Private%20 and%20 Public%20 (accessed on 20 June 2019).
- BFS Energiebereich-Gebäude nach Kanton, Gebäudekategorie, Heizungsart, Warmwasserversorgung, Energieträger und Bauperiode. Available online: https://www.pxweb.bfs.admin.ch/Selection.aspx?px_language=de&px_db=px-x-0902010000_102&px_tableid=px-x-0902010000_102%5 Cpx-x-0902010000_102.px&px_type=PX (accessed on 20 June 2019).
- Bundesamt für Energie. Schweizerische Elektrizitätsstatistik 2016; Bundesamt für Energie: Bern, Switzerland, 2017.
- Elcom. How Much is Your Electricity Consumption? Available online: https://www.elcom.admin.ch/elcom/de/home.html (accessed on 20 June 2019).
- ESTV Direkte Bundessteuer-Natürliche Personen-Kantone-Steuerjahr 2003–2015. Available online: https://www.estv.admin.ch/estv/de/home/allgemein/steuerstatistiken/fachinformationen/steuerstatistiken/direkte-bundessteuer.html (accessed on 20 June 2019).
- Watts, D.J.; Strogatz, S.H. Collective dynamics of small-world networks. Nature 1998, 393, 440–442. [Google Scholar] [CrossRef] [PubMed]
- Barabasi, A.L.; Bonabeau, E. Scale-free networks. Sci. Am. 2003, 288, 60–69. [Google Scholar] [CrossRef] [PubMed]
- Höök, M.; Li, J.; Oba, N.; Snowden, S. Descriptive and Predictive Growth Curves in Energy System Analysis. Nat. Resour. Res. 2011, 20, 103–116. [Google Scholar] [CrossRef] [Green Version]
- Kucharavy, D.; De Guio, R. Application of S-shaped curves. Procedia Eng. 2011, 9, 559–572. [Google Scholar] [CrossRef] [Green Version]
- Modis, T. Strengths and weaknesses of S-curves. Technol. Forecast. Soc. Chang. 2007, 74, 866–872. [Google Scholar] [CrossRef]
- Makrides, G.; Zinsser, G.E.; Georghiou, E.; Schubert, M.; Werner, J.H. Degradation of different photovoltaic technologies under field conditions. In Proceedings of the 35 th IEEE Photovoltaic Specialists Conference (PVSC), Honolulu, HI, USA, 20–25 June 2010; pp. 2332–2337. [Google Scholar]
- Zhai, P.; Williams, E.D. Analyzing consumer acceptance of photovoltaics (PV) using fuzzy logic model. Renew. Energy 2012, 41, 350–357. [Google Scholar] [CrossRef]
- Steg, L.; van den Berg, A.; de Groot, J. Environmental Psychology: An Introduction, 2nd ed.; Steg, L., van den Berg, A., de Groot, J., Eds.; Wiley: Hoboken, NJ, USA, 2012; ISBN 978-1-119-94219-1. [Google Scholar]
- Mahajan, V.; Muller, E.; Bass, F.M. New Product Diffusion Models in Marketing: A Review and Directions for Research. J. Mark. 1990, 54. [Google Scholar] [CrossRef]
- Larsen, O.N.; Hill, R.J. Mass Media and Interpersonal Communication in the Diffusion of a News Event. Am. Sociol. Rev. 1954, 19, 426–433. [Google Scholar] [CrossRef]
- Fagiolo, G.; Moneta, A.; Windrum, P. A Critical Guide to Empirical Validation of Agent-Based Models in Economics: Methodologies, Procedures, and Open Problems. Comput. Econ. 2007, 30, 195–226. [Google Scholar] [CrossRef]
- FOEN. Switzerland’s Climate Policy—Implementation of the Paris Agreement; FOEN: Bern, Switzerland, 2018. [Google Scholar]
- ElCom. Tarif-Rohdaten der Schweizerischen Verteilnetzbetreiber; Eidgenössische Elektrizitätskommission (ElCom): Bern, Switzerland, 2016. [Google Scholar]
- Densing, M.; Hirschberg, S.; Turton, H. Review of Swiss Electricity Scenarios 2050; Paul Scherrer Institute (PSI): Villigen, Switzerland, 2014. [Google Scholar]
- Schmela, M.; Döring, T.; Gómez, A.P.-B.; Arnaud, C.; Concas, G.; Dunlop, S.; Heisz, M.; Roesch, A.; Thoring, K.; Li, M.; et al. Global Market Outlook for Photovoltaics 2017–2021; Solarpower Europe: Brussels, Belgium, 2016. [Google Scholar]
- Parag, Y.; Sovacool, B.K. Electricity market design for the prosumer era. Nat. Energy 2016, 1, 16032. [Google Scholar] [CrossRef]
- Yale Center for Business and the Environment. Solarize Your Community: An Evidence-Based Guide for Accelerating the Adoption of Residential Solar; Yale Center for Business and the Environment: New Haven, CT, USA, 2017. [Google Scholar]
- BFS Population Size and Population Composition—Permanent Population by Age, Canton District and Commune (2010–2013). Available online: https://www.bfs.admin.ch/bfs/en/home/statistics/population/surveys/statpop.html (accessed on 20 June 2019).
- Kohli, R.; Hermman, A.; Babel, J. Szenarien zur Bevolkerungs-entwicklung der Schweiz 2015–2045; Bundesamt für Statistik (BFS): Neuchâtel, Switzerland, 2015.
Figure 1.
Solar PV support schemes in different European countries (own illustration).

Figure 2.
Penetration of solar PV systems in 2018, in Watts per Capita (own illustration).

Figure 3.
Annual sales (right axis), the cumulative installed capacity of solar PV in single- and two-family houses and comparison with the total cumulative installed capacity of solar PV (left axis) in Switzerland (own illustration based on [6]).
Figure 3.
Annual sales (right axis), the cumulative installed capacity of solar PV in single- and two-family houses and comparison with the total cumulative installed capacity of solar PV (left axis) in Switzerland (own illustration based on [6]).

Figure 4.
Assumed evolution of the agents in the model, per Swiss Canton.

Figure 5.
Population of agents (i.e., evolution of single- and two-family houses in Switzerland) per Sinus-Milieus® category; for a mapping to the IDs reported in the figure to the Sinus-Milieus® category, please see Table 1.
Figure 5.
Population of agents (i.e., evolution of single- and two-family houses in Switzerland) per Sinus-Milieus® category; for a mapping to the IDs reported in the figure to the Sinus-Milieus® category, please see Table 1.

Figure 6.
Annual rate of adoption (a), cumulative adopters (b), cumulative capacity (c) and average installed capacity per adopter (d) in the “Reference” scenario.
Figure 6.
Annual rate of adoption (a), cumulative adopters (b), cumulative capacity (c) and average installed capacity per adopter (d) in the “Reference” scenario.

Figure 7.
Cumulative adopters (a) and annual adopters (b) per Sinus-Milieus® category; for a mapping to the IDs reported in the figure to the Sinus-Milieus® category, please see Table 1.
Figure 7.
Cumulative adopters (a) and annual adopters (b) per Sinus-Milieus® category; for a mapping to the IDs reported in the figure to the Sinus-Milieus® category, please see Table 1.

Figure 8.
Share of the partial utilities in the total utility function of agents that invested in a solar PV system (average across all adopters).
Figure 8.
Share of the partial utilities in the total utility function of agents that invested in a solar PV system (average across all adopters).

Figure 9.
Geographical distribution of adopters; (a) number of adopters per Canton; (b) the percentage of adopters in total agents.
Figure 9.
Geographical distribution of adopters; (a) number of adopters per Canton; (b) the percentage of adopters in total agents.

Figure 10.
Overview of the installed solar PV capacity in single-family houses by 2050 (MW), according to different policy schemes, electricity price levels, specific investment cost, and discount rates, compared to the “Reference” scenario (dotted line).
Figure 10.
Overview of the installed solar PV capacity in single-family houses by 2050 (MW), according to different policy schemes, electricity price levels, specific investment cost, and discount rates, compared to the “Reference” scenario (dotted line).

Figure 11.
Drivers influencing the penetration of solar PV panels in single- and two-family houses.

Table 1.
Mapping of IDs used in the model to Sinus-Milieus® category and classification of Sinus-Milieus® categories to the different types of adopters.
Table 1.
Mapping of IDs used in the model to Sinus-Milieus® category and classification of Sinus-Milieus® categories to the different types of adopters.
| Model ID | Sinus-Milieus® Category | Classification to Adopter Type |
|---|---|---|
| 1 | Traditional | Late Majority, Laggards |
| 2 | Consumer-Materialists | Late Majority |
| 3 | Sensation-Oriented | Late Majority |
| 4 | Established | Late Majority, Early Majority |
| 5 | Modern Mainstreams | Early Majority |
| 6 | Adaptive Navigators | Early Majority |
| 7 | Cosmopolitan | Early Majority, Early Adopters |
| 8 | Liberal Intellectuals | Early Adopters |
| 9 | Social Ecologicals | Early Adopters |
| 10 | Performers | Early Adopters, Innovators |
Table 2.
Main assumptions of the Reference scenario.
| Assumption | 2035 | 2050 | Source/Comment |
|---|---|---|---|
| Average household size | 2.01 | 1.97 | Assumption in the Swiss Energy Strategy scenarios [44] |
| Electricity consumption per capita | –13% from 2000 levels | –18% from 2000 levels | Targets from the “Neue Energiepolitik” (NEP) scenario of the Swiss Energy Strategy [2,44] |
| Average electricity price (Rp./kWh) | 32.1 | 33.6 | Estimations from the NEP scenario; the prices vary per Canton based on [80] |
| Solar PV investment cost (CHF/kWp) | 1500–2600 | 1300–2000 | Overnight investment costs for sizes 1 –30 kWp from [3] |
| Average discount rate (%) | 5.5 | 5.5 | Discount rates are from the NEP scenario and vary with agents’ income |
| Feed-in tariff | - | - | Phase out from 2022 [2] |
| Capital subsidy | - | - | Phase out from 2030 [2] |
| Surcharge (Rp./kWh) | 2.3 | 2.3 | For the promotion of renewable electricity [2] |
| Building efficiency or emission standards | Not included | Not included | Inclusion of building standards, which are part of the Swiss energy strategy and the revised CO2 Act, would have influenced the results of this study |
| Building self-energy supply standards | Not included | Not included | |
| Market configuration | Average cost | Average cost | Excess electricity can be sold at the average production cost of a utility |
Table 3.
Overview of the assessed variants of the Reference scenario.
| Sensitivity Focus on | Variant Name | Variant Definition (Regarding the Reference Scenario) |
|---|---|---|
| Solar PV learning rates | High Cost | +20% investment cost in 2030 |
| Low Cost | –20% investment cost in 2030 | |
| Policy support schemes | Stronger Policy | +10 years continuation of the policy support |
| Weaker Policy | –5 years in policy support (earlier phase-out) | |
| Electricity price | Higher Price | +10% electricity prices until 2050 |
| Lower Price | –10% electricity prices until 2050 | |
| Cost of capital | High DRate | 12.5% discount rate on average across all agents |
© 2019 by the authors. Licensee MDPI, Basel, Switzerland. This article is an open access article distributed under the terms and conditions of the Creative Commons Attribution (CC BY) license (http://creativecommons.org/licenses/by/4.0/).
Share and Cite
MDPI and ACS Style
Panos, E.; Margelou, S. Long-Term Solar Photovoltaics Penetration in Single- and Two-Family Houses in Switzerland. Energies 2019, 12, 2460. https://doi.org/10.3390/en12132460
AMA Style
Panos E, Margelou S. Long-Term Solar Photovoltaics Penetration in Single- and Two-Family Houses in Switzerland. Energies. 2019; 12(13):2460. https://doi.org/10.3390/en12132460
Chicago/Turabian StylePanos, Evangelos, and Stavroula Margelou. 2019. "Long-Term Solar Photovoltaics Penetration in Single- and Two-Family Houses in Switzerland" Energies 12, no. 13: 2460. https://doi.org/10.3390/en12132460
Note that from the first issue of 2016, this journal uses article numbers instead of page numbers. See further details here.